The financial statements of Procter & Gamble (P&G) are presented in Appendix B of your textbook. The company's complete annual report, including the notes to the financial statements, is available online. Refer to P&G's financial statements and the accompanying notes to answer the following questions.
Instructions:
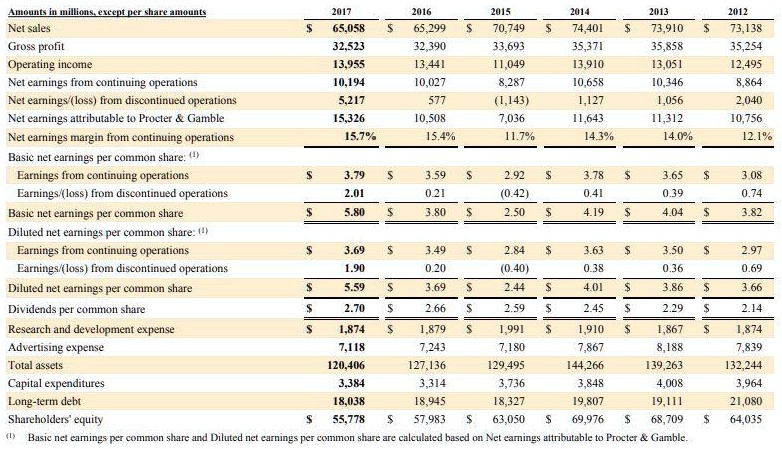
A. What were P&G's net sales for 2017?
B. What was the percentage of increase or decrease in P&G's net sales from 2016 to 2017? From 2015 to 2016? From 2015 to 2017?
C. In its notes to the financial statements, what criteria does P&G use to recognize revenue? As of 2017, the new revenue recognition guidance was not implemented.
D. Compare and contrast the old revenue recognition guidance with the new. Provide a thorough and clear explanation of the changes and how those changes might impact P&G.
E. How does P&G account for trade promotions? Does the accounting conform to accrual accounting concepts? Explain.
Amounts in millions, except per share amounts:
Net sales
Gross profit
Operating income
Net earnings from continuing operations
Net earnings/(loss) from discontinued operations
Net earnings attributable to Procter & Gamble
Net earnings margin from continuing operations
Basic net earnings per common share:
Earnings from continuing operations
Earnings/(loss) from discontinued operations
2017
$32,523
$13,955
$10,194
$5,217
$15,326
15.7%
2016
2015
$65,299
$70,749
$32,390
$33,693
$13,441
$11,049
$10,027
$8,287
$577
$1,143
$10,508
$7,036
15.4%
11.7%
2014
2013
2012
$74,401
$73,910
$73,138
$35,371
$35,858
$35,254
$13,910
$13,051
$12,495
$10,658
$10,346
$1,127
$1,056
$2,040
$11,643
$11,312
$10,756
14.3%
14.0%
12.1%
$3.79
$2.01
$5.80
$3.59
$0.21
$3.80
$2.92
($0.42)
$2.50
$3.78
$0.41
$4.19
$3.65
$0.39
$4.04
$3.08
$0.74
$3.82
Basic net earnings per common share
Diluted net earnings per common share:
Earnings from continuing operations
Earnings/(loss) from discontinued operations
Diluted net earnings per common share
$3.69
$3.49
$2.84
$3.63
$3.50
$2.97
$1.90
$0.20
($0.40)
$0.38
$0.36
$0.69
$5.59
$3.69
$2.44
$4.01
$3.86
$3.66
$2.70
$2.66
$2.59
$2.45
$2.29
$2.14
$1,111
$1,879
$1,991
$1,910
$1,867
$1,874
$7,118
$7,243
$7,180
$7,867
$8,188
$7,839
$120,406
$127,136
$129,495
$144,266
$139,263
$132,244
$3,314
$3,736
$4,008
$3,964
$18,038
$18,945
$18,327
$19,807
$19,111
$21,080
$55,778
$57,983
$63,050
$69,976
$68,709
$64,035
Dividends per common share
Research and development expense
Advertising expense
Total assets
Capital expenditures
Long-term debt
Shareholders' equity