The nature conservancy has hired you to estimate the population mean of all the heights of fully grown male West African giraffes living in captivity. To estimate this population mean, you select a random sample of 14 fully grown male West African giraffes living in captivity and record the heights (in \( \mathrm{m} \) ) of each male West African giraffe. Assume that the population is approximately normally distributed.
Based on your sample, follow the steps below to construct a \( 99 \% \) confidence interval for the population mean of all heights of fully grown male West African giraffes living in captivity. (If necessary, consult a list of formulas.)
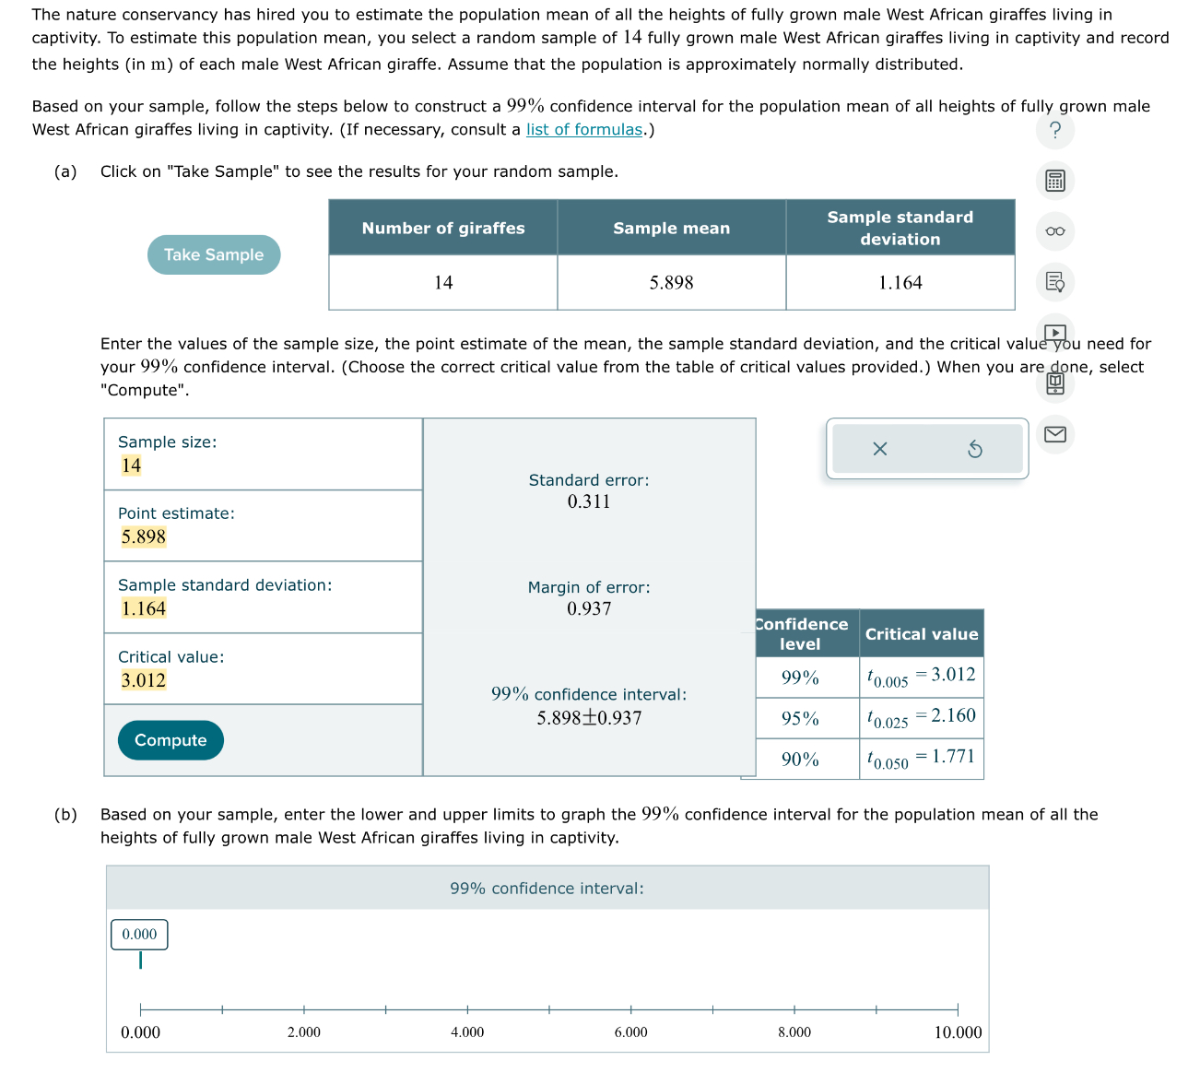
(a) Click on "Take Sample" to see the results for your random sample.
Take Sample
\begin{tabular}{|c|c|c|}
\hline Number of giraffes & Sample mean & \begin{tabular}{c}
Sample standard \\
deviation
\end{tabular} \\
\hline 14 & 5.898 & 1.164 \\
\hline
\end{tabular}
Enter the values of the sample size, the point estimate of the mean, the sample standard deviation, and the critical value pou need for your \( 99 \% \) confidence interval. (Choose the correct critical value from the table of critical values provided.) When you are done, select "Compute".
\begin{tabular}{|c|c|c|c|}
\hline \begin{tabular}{l}
Sample size: \\
14
\end{tabular} & \multirow{2}{*}{\begin{tabular}{l}
Standard error: \\
\( \qquad 0.311 \)
\end{tabular}} & \multirow{2}{*}{\multicolumn{2}{|c|}{\( \times \quad 5 \)}} \\
\hline \begin{tabular}{l}
Point estimate: \\
5.898
\end{tabular} & & & \\
\hline \begin{tabular}{l}
Sample standard deviation: \\
1.164
\end{tabular} & \multirow[t]{2}{*}{\begin{tabular}{l}
Margin of error: \\
0.937
\end{tabular}} & & \\
\hline Critical value: & & \begin{tabular}{l}
Confidence \\
level
\end{tabular} & Critical value \\
\hline 3.012 & \multirow{3}{*}{\begin{tabular}{c}
\( 99 \% \) confidence interval: \\
\( 5.898 \pm 0.937 \)
\end{tabular}} & \( 99 \% \) & \( t_{0.005}=3.012 \) \\
\hline & & \( 95 \% \) & \( t_{0.025}=2.160 \) \\
\hline Comp & & \( 90 \% \) & \( t_{0.050}=1.771 \) \\
\hline
\end{tabular}
(b) Based on your sample, enter the lower and upper limits to graph the \( 99 \% \) confidence interval for the population mean of all the heights of fully grown male West African giraffes living in captivity.
99\% confidence interval:
\[
0.000
\]