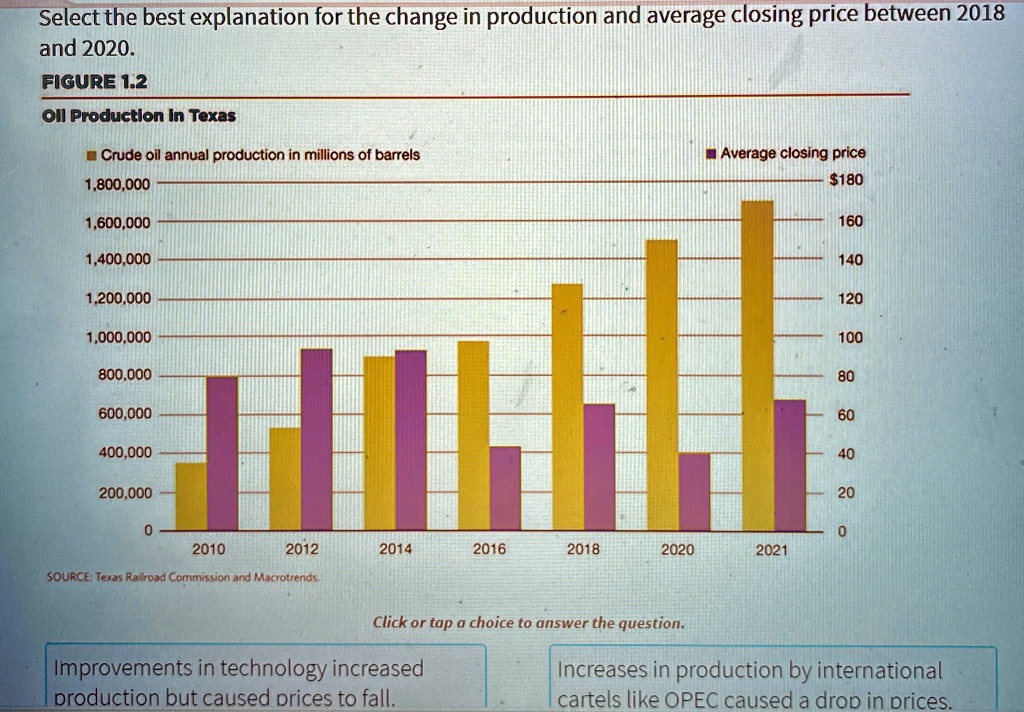
Select the best explanation for the change in production and average closing price between 2018 and 2020.
FIGURE 1.2
Oil Production in Texas
?Crude oil annual production in millions of barrels
1,800,000
1,600,000
1,400,000
1,200,000
1,000,000
800,000
600,000
400,000
200,000
0
2010
2012
SOURCE: Texas Railroad Commission and Macrotrends.
Average closing price
$180
160
140
120
100
80
60
40
20
0
2014
2016
2018
2020
2021
Click or tap a choice to answer the question.
Improvements in technology increased production but caused prices to fall.
Increases in production by international cartels like OPEC caused a drop in prices.