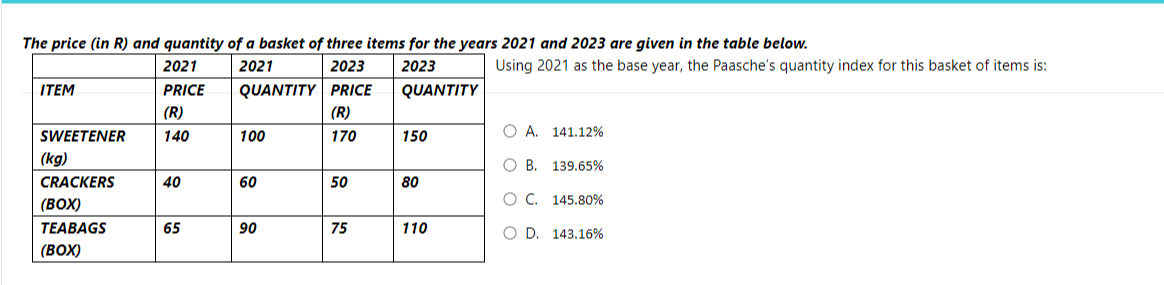
The price (in R) and quantity of a basket of three items for the years 2021 and 2023 are given in the table below.
\begin{tabular}{|l|l|l|l|l|}
\hline & 2021 & 2021 & 2023 & 2023 \\
\hline ITEM & \begin{tabular}{l}
PRICE \\
\( (R) \)
\end{tabular} & QUANTITY & \begin{tabular}{l}
PRICE \\
\( (R) \)
\end{tabular} & QUANTITY \\
\hline \begin{tabular}{l}
SWEETENER \\
\( (\mathrm{kg}) \)
\end{tabular} & 140 & 100 & 170 & 150 \\
\hline \begin{tabular}{l}
CRACKERS \\
(BOX)
\end{tabular} & 40 & 60 & 50 & 80 \\
\hline \begin{tabular}{l}
TEABAGS \\
(BOX)
\end{tabular} & 65 & 90 & 75 & 110 \\
\hline
\end{tabular}
Using 2021 as the base year, the Paasche's quantity index for this basket of items is:
A. \( 141.12 \% \)
B. \( 139.65 \% \)
C. \( 145.80 \% \)
D. \( 143.16 \% \)