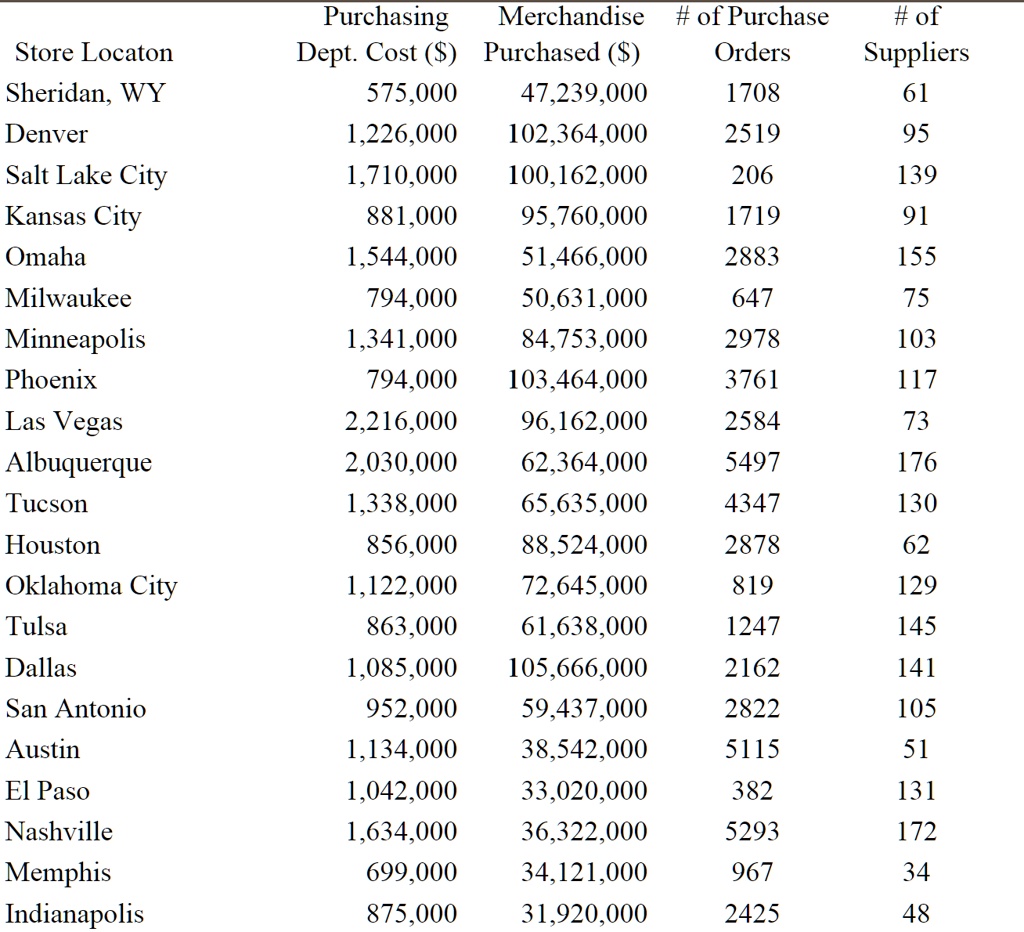
1a. Put Purchasing Dept Cost on the Y-axis for clarity.
1b. Consider the visualizations. Do you notice any outliers and can you explain them with case data? Should you do anything about them (i.e. retain, adjust, or exclude)? Do any potential drivers appear more promising?
1c. Run the possible regression combinations (i.e. all potential drivers at once and then each of the possible pairs). Focus on the coefficients and consider what they are telling you. Which is best?
2a. What would you tell Joe about cost behaviors at the stores?
2b. What recommendations would you make?
Purchasing Merchandise Dept. Cost ($) Purchased ($)
# of Purchase Orders 47,239,000 1708
# of Suppliers 61 95 139 91 155 75 103 117 73 176 130 62 129 145 141 105 51 131 172 34
Store Location
Sheridan, WY
575,000
Denver
1,226,000
102,364,000
2519 206 1719 2883 647 2978 3761 2584 5497 4347
Salt Lake City Kansas City Omaha Milwaukee Minneapolis Phoenix
1,710,000
100,162,000
881,000
95,760,000
1,544,000
51,466,000
794,000
50,631,000
1,341,000
84,753,000
794,000
103,464,000
Las Vegas
2,216,000
96,162,000
Albuquerque Tucson
2,030,000
62,364,000 65,635,000
1,338,000
Houston Oklahoma City Tulsa Dallas San Antonio
856,000
88,524,000
2878 819 1247 2162 2822 5115 382 5293 967 2425
1,122,000
72,645,000
863,000 1,085,000 952,000
61,638,000
105,666,000
59,437,000
Austin El Paso Nashville
1,134,000
38,542,000
1,042,000 1,634,000 699,000
33,020,000
36,322,000
Memphis Indianapolis
34,121,000
875,000
31,920,000