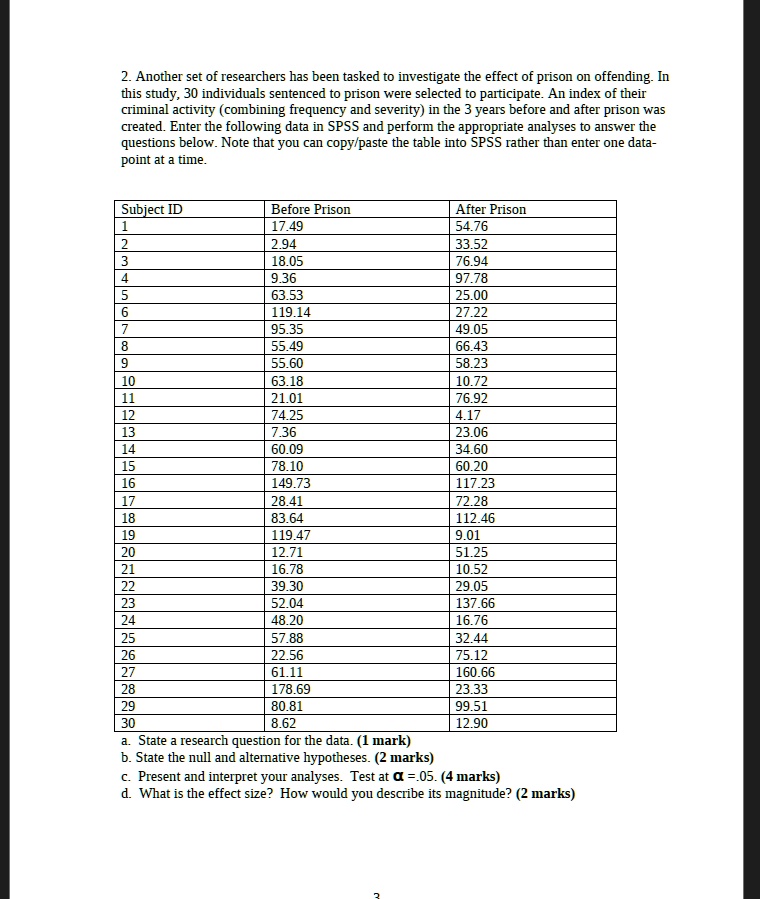
Another set of researchers has been tasked to investigate the effect of prison on offending. In this study, 30 individuals sentenced to prison were selected to participate. An index of their criminal activity (combining frequency and severity) in the 3 years before and after prison was created. Enter the following data in SPSS and perform the appropriate analyses to answer the questions below. Note that you can copy/paste the table into SPSS rather than enter one datapoint at a time.
able[[Subject ID,Before Prison,After Prison],[1,17.49,54.76],[2, able[[2.94]],33.52],[3,18.05,76.94],[4,9.36,97.78],[5,63.53,25.00],[6, able[[119.14]],27.22],[7,95.35,49.05],[8,55.49,66.43],[9,55.60,58.23],[10,63.18,10.72],[11,21.01,76.92],[12, able[[74.25]],4.17],[13, able[[7.36]],23.06],[14,60.09,34.60],[15,78.10,60.20],[16,149.73,117.23],[17,28.41,72.28],[18, able[[83.64]],112.46],[19, able[[119.47]],9.01],[20,12.71,51.25],[21, able[[16.78]],10.52],[22,39.30,29.05],[23,52.04,137.66],[24,48.20,16.76],[25,57.88,32.44],[26,22.56,75.12],[27,61.11,160.66],[28, able[[178.69]],23.33],[29,80.81,99.51],[30,8.62,12.90]]
a. State a research question for the data. (1 mark)
b. State the null and alternative hypotheses. (2 marks)
c. Present and interpret your analyses. Test at alpha =.05. (4 marks)
d. What is the effect size? How would you describe its magnitude? (2 marks)
2. Another set of researchers has been tasked to investigate the effect of prison on offending. In this study, 30 individuals sentenced to prison were selected to participate. An index of their criminal activity (combining frequency and severity) in the 3 years before and after prison was created. Enter the following data in SPSS and perform the appropriate analyses to answer the questions below. Note that you can copy/paste the table into SPSS rather than enter one data- point at a time.
Subject ID Before Prison After Prison 1 17.49 54.76 2 2.94 33.52 3 18.05 76.94 4 9.36 97.78 5 63.53 25.00 6 119.14 27.22 7 95.35 49.05 8 55.49 66.43 9 55.60 58.23 10 63.18 10.72 11 21.01 76.92 12 74.25 4.17 13 7.36 23.06 14 60.09 34.60 15 78.10 60.20 16 149.73 117.23 17 28.41 72.28 18 83.64 112.46 19 119.47 9.01 20 12.71 51.25 21 16.78 10.52 22 39.30 29.05 23 52.04 137.66 24 48.20 16.76 25 57.88 32.44 26 22.56 75.12 27 61.11 160.66 28 178.69 23.33 29 80.81 99.51 30 8.62 12.90 a. State a research question for the data. (1 mark) b. State the null and alternative hypotheses. (2 marks) c. Present and interpret your analyses. Test at =.05. (4 marks) d. What is the effect size? How would you describe its magnitude? (2 marks)