Ace - AI Tutor
Ask Our Educators
Textbooks
My Library
Flashcards
Scribe - AI Notes
Notes & Exams
Download App
Gih Gih

Gih G.

Divider

Questions asked

ANSWERED

Sheryl Ezze verified

Numerade educator

(a) Construct a scatterplot of the funding in 2012 (y) versus the funding in 2006 (x). y 250 200 150 100 50 0 50 100 150 200 250 x 2012 Funding (millions of dollars) 2006 Funding (millions of dollars)

View Answer
divider
ANSWERED

Jerelyn Nevil verified

Numerade educator

(a) Construct a scatterplot of the funding in 2012 (y) versus the funding in 2006 (x). y 250 200 150 100 50 0 50 100 150 200 250 x 2012 Funding (millions of dollars) 2006 Funding (millions of dollars)

View Answer
divider
ANSWERED

Kari Hasz verified

Numerade educator

Determine whether the association between the two variables is positive or negative. The number of hours a college student spent studying in the past 24 hours and the number of hours the student spent sleeping in the past 24 hours The association between the number of hours a college student spent studying in the past 24 hours and the number of hours the student spent sleeping in the past 24 hours is (Choose one). positive negative

View Answer
divider
ANSWERED

Kari Hasz verified

Numerade educator

Determine whether the association between the two variables is positive or negative. The number of miles on a car's odometer and its resale value The association between the number of miles on a car's odometer and its resale value is

View Answer
divider
ANSWERED

Ariana Nash verified

Numerade educator

Determine whether the association between the two variables is positive or negative. A person's age and the person's income The association between a person's age and the person's income is (Choose one). positive negative

View Answer
divider
ANSWERED

Robin Corrigan verified

Numerade educator

Compute the correlation coefficient. egin{tabular}{l|lllll} ( x ) & 7 & 4 & 5 & 2 & 1 \ hline( y ) & 2 & 6 & 5 & 1 & 7 end{tabular} Send data to Excel The correlation coefficient is ( quad ). Round the answer to three decimal places.

View Answer
divider
ANSWERED

Lucas Finney verified

Numerade educator

Hockey sticks: The breaking strength of hockey stick shafts made of two different graphite-kevlar composites yields the following results (in Newtons). Composite 1: 561.3 520.1 555 509.6 507.1 520 536.1 521.4 539.5 Composite 2: 516.2 553.9 577.5 576.9 477.9 509.7 479.4 478.9 501.9 582.6 615.5 523.9 547.7 F =

View Answer
divider
ANSWERED

Paul A. verified

Numerade educator

No smoking: The General Social Survey conducted a poll of 657 adults in which the subjects were asked whether they agree that the government should prohibit smoking in public places. In addition, each was asked how many people lived in his or her household. The results are summarized in the following contingency table. egin{tabular}{lccccc} hline & multicolumn{5}{c}{ Household Size } \ hline & ( mathbf{1} ) & ( mathbf{2} ) & ( mathbf{3} ) & ( mathbf{4} ) & ( mathbf{5} ) \ hline Agree & 78 & 103 & 54 & 33 & 41 \ No Opinion & 25 & 45 & 19 & 17 & 8 \ Disagree & 51 & 63 & 46 & 43 & 31 \ hline end{tabular} (b) Find the ( P )-value. Round your answer to at least four decimal places. The ( P )-value is 0.0028.

View Answer
divider
ANSWERED

Supreeta N verified

Numerade educator

Hockey sticks: The breaking strength of hockey stick shafts made of two different graphite-kevlar composites yields the following results (in Newtons). ( egin{array}{llllll} ext { Composite 1: } & 561.3 & 520.1 & 555 & 509.6 & 507.1 \ & 520 & 536.1 & 521.4 & 539.5 & \ ext { Composite 2: } & 516.2 & 553.9 & 577.5 & 576.9 & 477.9 \ & 509.7 & 479.4 & 478.9 & 501.9 & 582.6 \ & 615.5 & 523.9 & 547.7 & & end{array} ) Send data to Excel Can you conclude that the standard deviation of the breaking strength differs between the two composites? Use the ( alpha=0.10 ) level of significance. Compute the test statistic. Round the answer to two decimal places. [ F= ]

View Answer
divider
ANSWERED

Jon Southam verified

Numerade educator

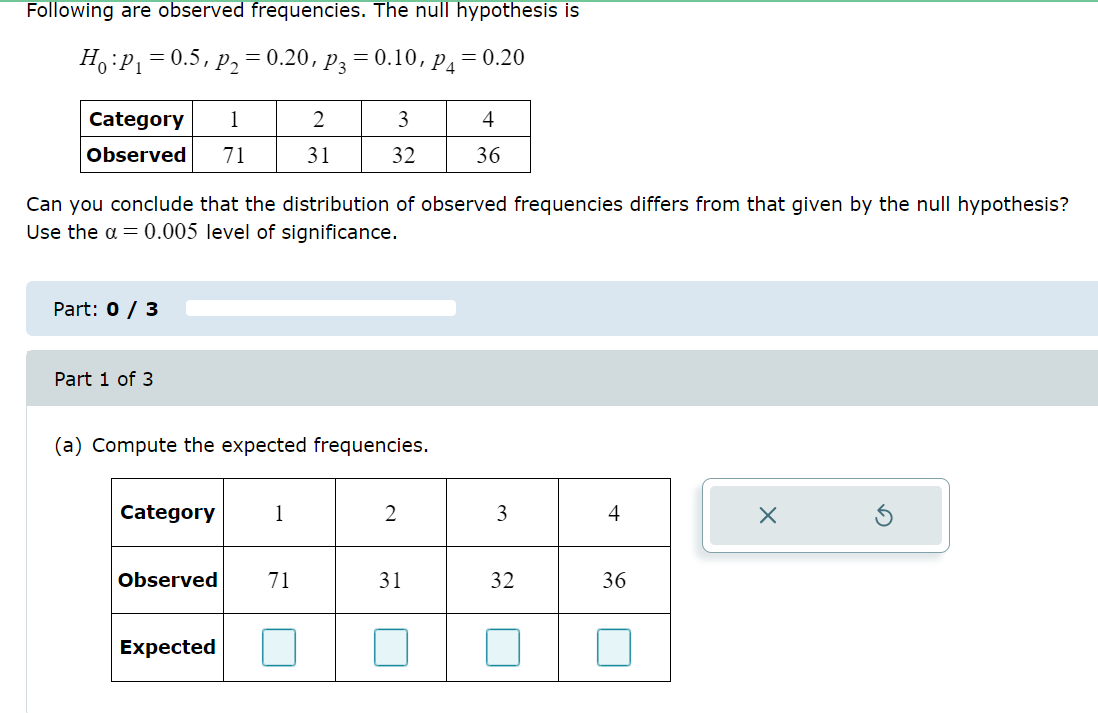
Following are observed frequencies. The null hypothesis is ( H_{0}: p_{1}=0.5, p_{2}=0.20, p_{3}=0.10, p_{4}=0.20 ) | Category | 1 | 2 | 3 | 4 | | :--- | :--- | :--- | :--- | :--- | | Observed | 71 | 31 | 32 | 36 | Can you conclude that the distribution of observed frequencies differs from that given by the null hypothesis? Use the ( alpha=0.005 ) level of significance. (a) Compute the expected frequencies. | Category | 1 | 2 | 3 | 4 | | :--- | :--- | :--- | :--- | :--- | | Observed | 71 | 31 | 32 | 36 | | Expected | | | | |

View Answer
divider