Unit 8: Sinusoidal Functions
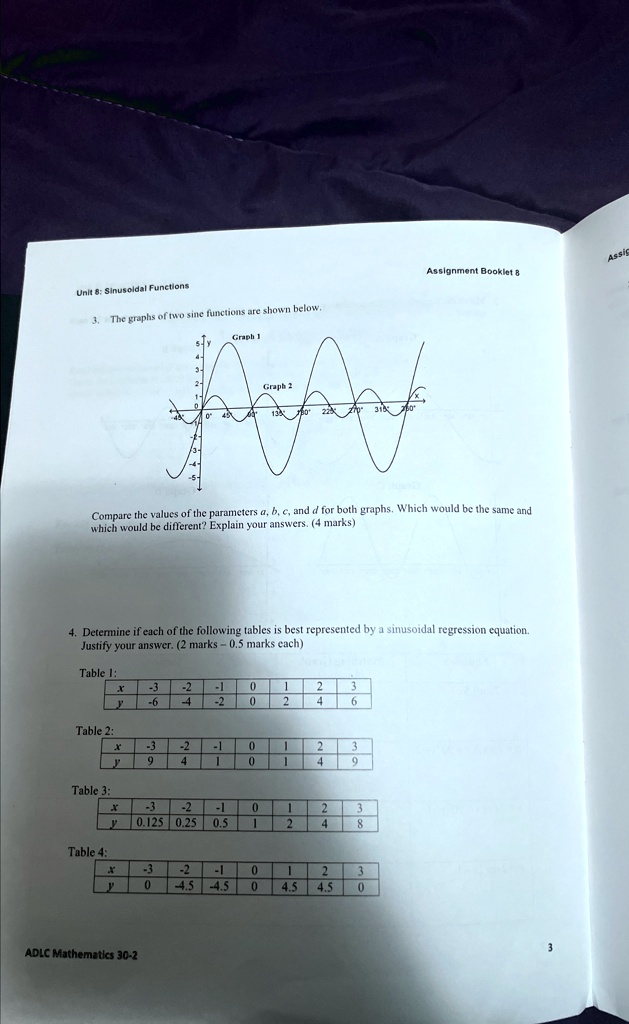
3. The graphs of two sine functions are shown below.
Graph 1
Graph 2
Assignment Booklet 8
Compare the values of the parameters $a$, $b$, $c$, and $d$ for both graphs. Which would be the same and
which would be different? Explain your answers. (4 marks)
4. Determine if each of the following tables is best represented by a sinusoidal regression equation.
Justify your answer. (2 marks - 0.5 marks each)
Table 1:
$x$ -3 -2 -1 0 1 2 3
$y$ -6 -4 -2 0 2 4 6
Table 2:
$x$ -3 -2 -1 0 1 2 3
$y$ 9 4 1 0 1 4 9
Table 3:
$x$ -3 -2 -1 0 1 2 3
$y$ 0.125 0.25 0.5 1 2 4 8
Table 4:
$x$ -3 -2 -1 0 1 2 3
$y$ 0 -4.5 -4.5 0 4.5 4.5 0
ADLC Mathematics 30-2
3