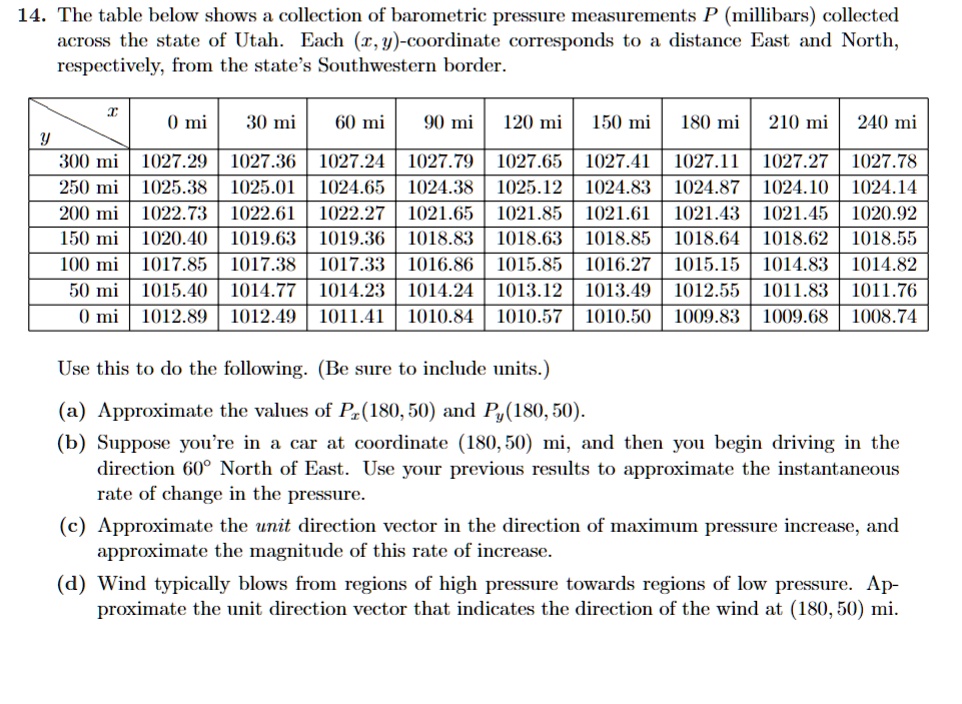
14. The table below shows a collection of barometric pressure measurements P (millibars) collected across the state of Utah. Each (,-coordinate corresponds to a distance East and North respectively,from the state's Southwestern border.
T
0 mi
30 mi
60 mi
90 mi
120 mi
150 mi
180 mi
210 mi
240 mi
y 300 mi 250 mi 200 mi 150 mi 100 mi 50 mi 0 mi
1027.29 1025.38 1022.73 1020.40
1027.36 1025.01 1022.61 1019.63 1017.38
1027.24 1024.65 1022.27 1019.36
1027.79 1024.38 1021.65 1018.83 1016.86
1027.65 1025.12
1027.41
1027.11
1027.27
1027.78 1024.14 1020.92 1018.55 1014.82
1024.83 1021.61 1018.85 1016.27 1013.49 1010.50
1024.87 1021.43 1018.64 1015.15
1024.10 1021.45 1018.62 1014.83
1021.85 1018.63
1017.85
1017.33
1015.85
1015.40 1012.89
1014.77 1012.49
1014.23 1011.41
1014.24 1010.84
1013.12 1010.57
1012.55 1009.83
1011.83 1009.68
1011.76 1008.74
Use this to do the following. (Be sure to include units.)
(a) Approximate the values of Pr(180,50) and Py180,50)
(b) Suppose you're in a car at coordinate (180,50) mi, and then you begin driving in the direction 60 North of East. Use your previous results to approximate the instantaneous rate of change in the pressure.
(c) Approximate the unit direction vector in the direction of maximum pressure increase, and approximate the magnitude of this rate of increase.
(d) Wind typically blows from regions of high pressure towards regions of low pressure. Ap proximate the unit direction vector that indicates the direction of the wind at (180, 50) mi.