Data Handling
Interpret the results presented in the provided figures to answer the questions below.
In the Neurogenetics Research Facility, the team has been investigating a unique mouse model exhibiting progressive neurological decline reminiscent of human neurodegenerative diseases. A mutated gene, named lpg1621, surfaced as a candidate of interest due to its sequence similarity to deubiquitinating enzymes (DUBs). To explore Ipg1621 function, the team has conducted an analysis of the corresponding enzyme Ipg16211 ^(1-348), while particularly focusing on its interaction with PCNA, a protein known to be ubiquitinated in response to cellular stress. The goal is to discern the role of lpg1621^(1-348).
a) Review Figure 1, which depicts a ubiquitination assay involving PCNA and a mutant variant. Outline the method used to monitor ubiquitination and infer the significance of observed molecular weight changes in PCNA over the indicated time intervals.
b) Examine Figure 2, showcasing a deubiquitination assay post-stress induction. Discuss how the experiment tracks changes in PCNA and what the temporal alterations suggest about the deubiquitination mechanism in response to DNA damage.
c) Consider Figure 3, detailing an enzymatic activity assay. Describe the process used to assess the enzyme's specificity for different ubiquitin chains. Analyze the cleavage patterns to determine the enzyme's activity profile.
d) Reflect on the potential link between the enzymatic function of lpg162 1-348 and the neurological symptoms observed in the mouse model. Contemplate the broader implications of ubiquitination dynamics in neuronal health.
Abstract: Based on the provided Figures and your analysis, construct an abstract to summarize the study. The abstract needs to include a title, background, methods, results, and conclusion.
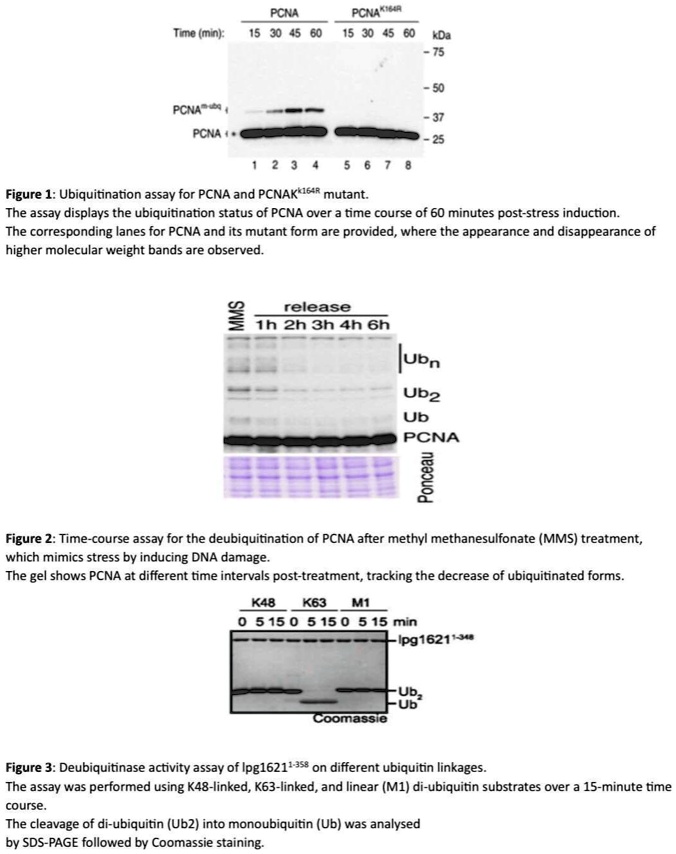
Figure 1: Ubiquitination assay for PCNA and PCNAK ^(kappa 164R) mutant. The assay displays the ubiquitination status of PCNA over a time course of 60 minutes post-stress induction. The corresponding lanes for PCNA and its mutant form are provided, where the appearance and disappearance of higher molecular weight bands are observed.
Figure 2: Time-course assay for the deubiquitination of PCNA after methyl methanesulfonate (MMS) treatment, which mimics stress by inducing DNA damage. The gel shows PCNA at different time intervals post-treatment, tracking the decrease of ubiquitinated forms.
Figure 3: Deubiquitinase activity assay of lpg1621 1-358 on different ubiquitin linkages. The assay was performed using K48-linked, K63-linked, and linear (M1) di-ubiquitin substrates over a 15-minute time course. The cleavage of di-ubiquitin (Ub2) into monoubiquitin (Ub) was analyzed by SDS-PAGE followed by Coomassie staining.
PCNA PCNAK164R Time (min): 15 30 45 60 15 30 45 60 kDa -75 -50 -37 -25 23 4
Figure 1: Ubiquitination assay for PCNA and PCNAKk164R mutant. The assay displays the ubiquitination status of PCNA over a time course of 60 minutes post-stress induction. The corresponding lanes for PCNA and its mutant form are provided, where the appearance and disappearance of higher molecular weight bands are observed.
release 1h 2h 3h 4h 6h Ubn Ub2 Ub PCNA Ponceau
Figure 2: Time-course assay for the deubiquitination of PCNA after methyl methanesulfonate (MMS) treatment, which mimics stress by inducing DNA damage. The gel shows PCNA at different time intervals post-treatment, tracking the decrease of ubiquitinated forms.
K48 K63 M1 051505150515min -lpg1621-38 Ub. -Ub Coomassie
Figure 3: Deubiquitinase activity assay of Ipg16211-3ss on different ubiquitin linkages. The assay was performed using K48-linked, K63-linked, and linear (M1) di-ubiquitin substrates over a 15-minute time course. The cleavage of di-ubiquitin (Ub2) into monoubiquitin (Ub) was analyzed by SDS-PAGE followed by Coomassie staining.