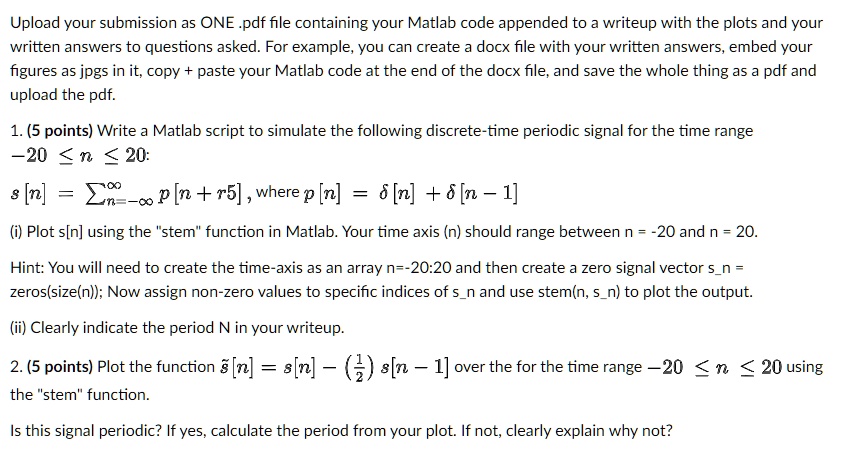
Text: Upload your submission as ONE.pdf file containing your Matlab code appended to a writeup with the plots and your written answers to questions asked. For example, you can create a docx file with your written answers, embed your figures as jpgs in it, copy + paste your Matlab code at the end of the docx file, and save the whole thing as a pdf and upload the pdf.
1. (5 points) Write a Matlab script to simulate the following discrete-time periodic signal for the time range -20 < n < 20:
s[n] = δ[n] - 5P[n+5], where P[n] = 8δ[n] + 8δ[n-1]
(i) Plot s[n] using the "stem" function in Matlab. Your time axis (n) should range between n = -20 and n = 20.
Hint: You will need to create the time-axis as an array n = -20:20 and then create a zero signal vector s_n = zeros(size(n)). Now assign non-zero values to specific indices of s_n and use stem(n, s_n) to plot the output.
(ii) Clearly indicate the period N in your writeup.
2. (5 points) Plot the function 3s[n] = s[n] - s[n - 1] over the time range -20 ≤ n ≤ 20 using the "stem" function.
Is this signal periodic? If yes, calculate the period from your plot. If not, clearly explain why not?