This is my last part of my lab report. I need help with this parts. Pls
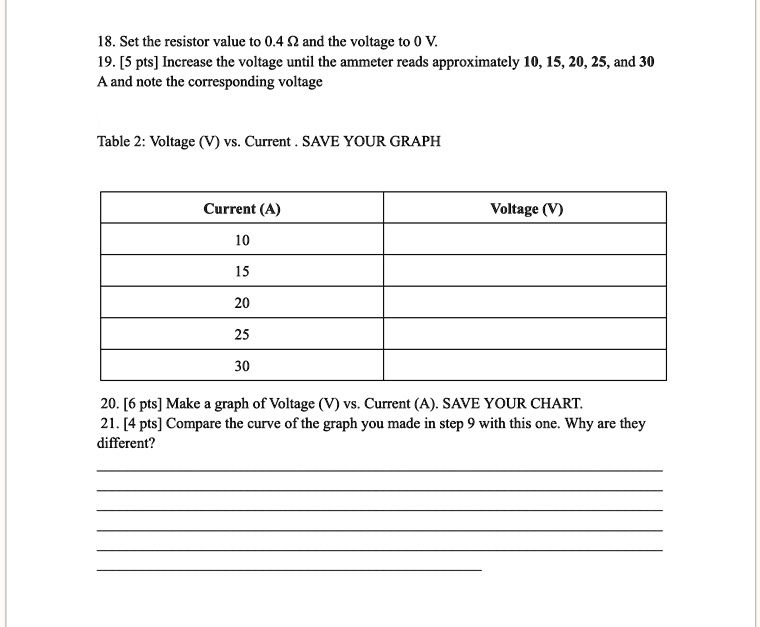
18.Set the resistor value to 0.4 and the voltage to 0 V 19. [5 pts] Increase the voltage until the ammeter reads approximately 10, 15, 20, 25, and 30 A and note the corresponding voltage
Table 2:Voltage (Vvs.Current.SAVE YOUR GRAPH
Current (A)
Voltage (V)
10
15
20
25
30
20.[6 pts]Make a graph of Voltage (Vvs.Current (A.SAVE YOUR CHART. 21. [4 pts] Compare the curve of the graph you made in step 9 with this one. Why are they different?