LG
?
125%
ew
Zoom
Insert
Chart Table
A
Text Shape Media Comment Share Format Document
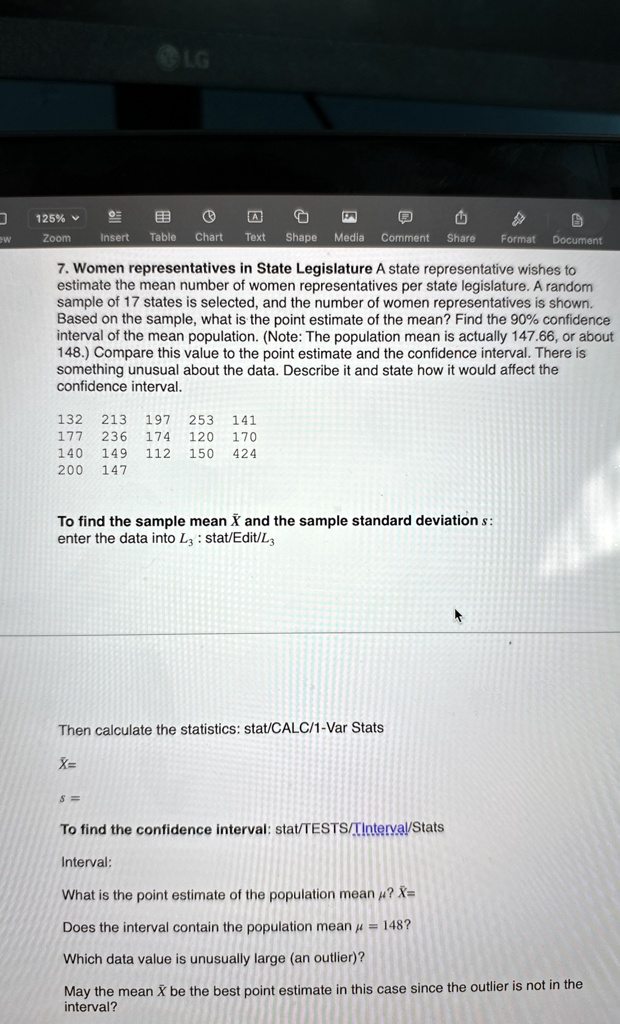
7. Women representatives in State Legislature A state representative wishes to
estimate the mean number of women representatives per state legislature. A random
sample of 17 states is selected, and the number of women representatives is shown.
Based on the sample, what is the point estimate of the mean? Find the 90% confidence
interval of the mean population. (Note: The population mean is actually 147.66, or about
148.) Compare this value to the point estimate and the confidence interval. There is
something unusual about the data. Describe it and state how it would affect the
confidence interval.
132 213 197 253 141
177 236 174 120 170
140 149 112 150 424
200 147
To find the sample mean $\bar{X}$ and the sample standard deviations:
enter the data into $L_3$: stat/Edit/$L_3$
Then calculate the statistics: stat/CALC/1-Var Stats
$\bar{X}$=
$s$=
To find the confidence interval: stat/TESTS/TInterval/Stats
Interval:
What is the point estimate of the population mean $\mu$? $\bar{X}$=
Does the interval contain the population mean $\mu = 148$?
Which data value is unusually large (an outlier)?
May the mean $\bar{X}$ be the best point estimate in this case since the outlier is not in the
interval?