Texts: Please answer question 4 and 59.029.0759.0759.2759.29999.29999.3259.359.37499.39999.39999.49.4259.4259.47499.4759.59.52499.5259.5259.54999.5759.59999.69.69.69.64999.67499.67499.6759.69999.79.72499.7259.7259.74999.759.759.7759.7759.8259.8259.8259.84999.859.859.8759.89999.99.99.9259.959.97499.9759.97510.024910.02510.074910.07510.07510.099910.110.12510.12510.149910.1510.17510.210.224910.22510.2510.2510.2510.2510.2510.274910.27510.310.32510.3510.3510.374910.410.424910.42510.42510.4510.47510.47510.499910.510.510.610.649910.724910.72510.849910.87510.875114. What is the value of (O-E)2/E for the first class? 5. What is the value of the chi-squared statistic? (As the sum over all seven classes.)
Microsoft W X
How To Make
Get Student
Show Data
X PLSC214topic
Tables.pdf
XI
Topic 7:PLSC
CPost a new q +
v
X
C
File C:/Users/Ms.Manshi/Downloads/plsc214labmanual2016%20(1).pdf
=
M
:
Microsoft Word - plsc214labmanual2016.doc
31/119
100%
A
{Example 9
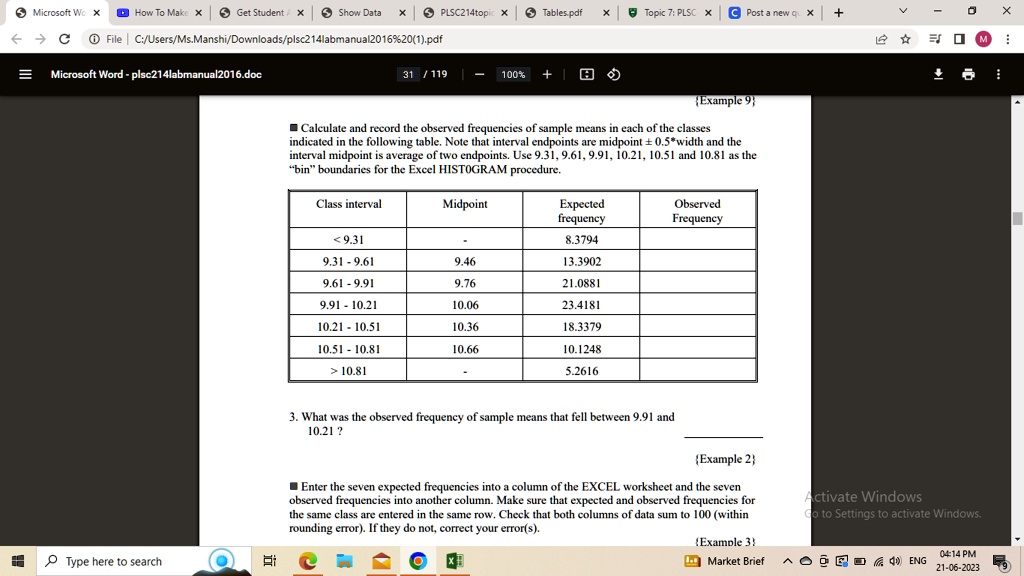
Calculate and record the observed frequencies of sample means in each of the classes indicated in the following table. Note that interval endpoints are midpoint 0.5*width and the interval midpoint is average of two endpoints. Use 9.31, 9.61, 9.91, 10.21, 10.51 and 10.81 as the bin boundaries for the Excel HISTOGRAM procedure.
Class interval
Midpoint
Expected frequency 8.3794 13.3902 21.0881 23.4181 18.3379
Observed Frequency
9.31 9.31 - 9.61 9.61 - 9.91
9.46
9.76 10.06
9.91 - 10.21
10.21 - 10.51
10.36
10.51 - 10.81
10.66
10.1248 5.2616
>10.81
3. What was the observed frequency of sample means that fell between 9.91 and 10.21?
{Example 2}
Enter the seven expected frequencies into a column of the Excel worksheet and the seven observed frequencies into another column. Make sure that expected and observed frequencies for the same class are entered in the same row. Check that both columns of data sum to 100 (within rounding error). If they do not, correct your error(s). {Example3} 04:14 PM Market Brief ENG 21-06-2023 9
Type here to search