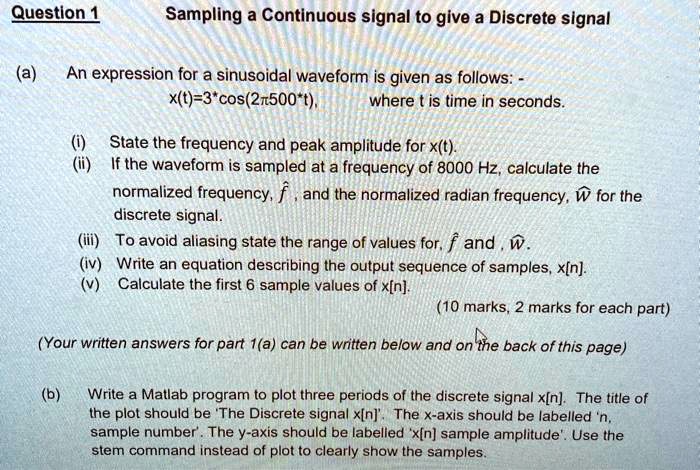
Question 1
Sampling a Continuous signal to give a Discrete signal
(a)
An expression for a sinusoidal waveform is given as follows: -
x(t)=3*cos(2?500*t),
where t is time in seconds.
(i) State the frequency and peak amplitude for x(t).
(ii) If the waveform is sampled at a frequency of 8000 Hz, calculate the
normalized frequency, \(\hat{f}\), and the normalized radian frequency, \(\hat{\omega}\) for the
discrete signal.
(iii) To avoid aliasing state the range of values for, \(\hat{f}\) and, \(\hat{\omega}\).
(iv) Write an equation describing the output sequence of samples, x[n].
(v) Calculate the first 6 sample values of x[n].
(10 marks, 2 marks for each part)
(Your written answers for part 1(a) can be written below and on the back of this page)
(b)
Write a Matlab program to plot three periods of the discrete signal x[n]. The title of
the plot should be 'The Discrete signal x[n]'. The x-axis should be labelled 'n,
sample number'. The y-axis should be labelled 'x[n] sample amplitude'. Use the
stem command instead of plot to clearly show the samples.