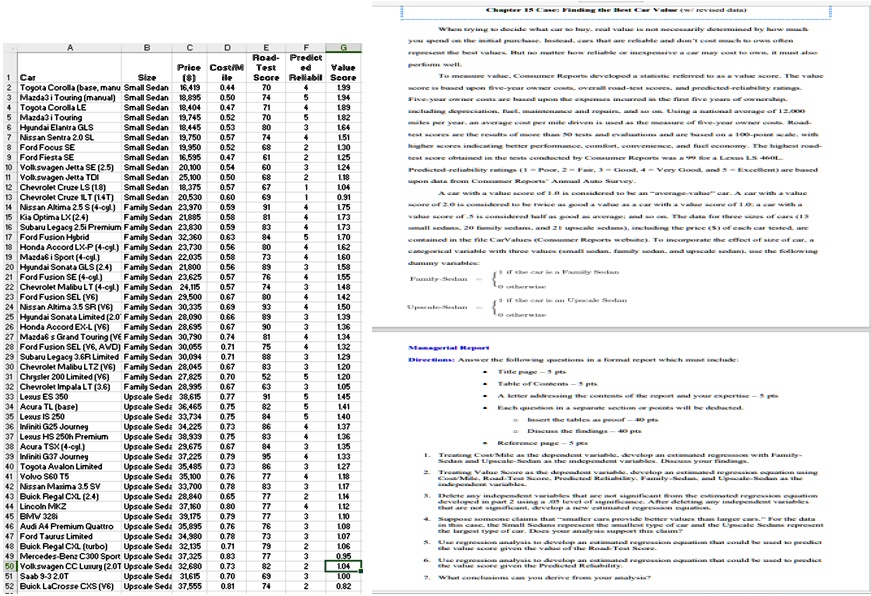
When trying to decide what car to buy, real value is not necessarily determined by how much you spend on the initial purchase. Instead, cars that are reliable and don’t cost much to own often represent the best values. But no matter how reliable or inexpensive a car may cost to own, it must also perform well. To measure value, Consumer Reports developed a statistic referred to as a value score. The value score is based upon five-year owner costs, overall road-test scores, and predicted-reliability ratings. Five-year owner costs are based upon the expenses incurred in the first five years of ownership, including depreciation, fuel, maintenance and repairs, and so on. Using a national average of 12,000 miles per year, an average cost per mile driven is used as the measure of five-year owner costs. Road-test scores are the results of more than 50 tests and evaluations and are based on a 100-point scale, with higher scores indicating better performance, comfort, convenience, and fuel economy. The highest road-test score obtained in the tests conducted by Consumer Reports was a 99 for a Lexus LS 460L. Predicted-reliability ratings (1 = Poor, 2 = Fair, 3 = Good, 4 = Very Good, and 5 = Excellent) are based upon data from Consumer Reports’ Annual Auto Survey. A car with a value score of 1.0 is considered to be an “average-value” car. A car with a value score of 2.0 is considered to be twice as good a value as a car with a value score of 1.0; a car with a value score of .5 is considered half as good as average; and so on. The data for three sizes of cars (13 small sedans, 20 family sedans, and 21 upscale sedans), including the price ($) of each car tested, are contained in the file CarValues (Consumer Reports website). To incorporate the effect of size of car, a categorical variable with three values (small sedan, family sedan, and upscale sedan), use the following dummy variables: Family sedan = 1 if the car is a family sedan 0 otherwise Upscale Sedan = 1 if the car is an upscale sedan 0 otherwise Managerial Report Directions: Answer the following questions in a formal report which must include: • Title page – 5 pts • Table of Contents – 5 pts • A letter addressing the contents of the report and your expertise – 5 pts • Each question in a separate section or points will be deducted. o Insert the tables as proof – 40 pts o Discuss the findings – 40 pts • Reference page – 5 pts 1. Treating Cost/Mile as the dependent variable, develop an estimated regression with Family Sedan and Upscale-Sedan as the independent variables. Discuss your findings. 2. Treating Value Score as the dependent variable, develop an estimated regression equation using Cost/Mile, Road-Test Score, Predicted Reliability, Family-Sedan, and Upscale-Sedan as the independent variables. 3. Delete any independent variables that are not significant from the estimated regression equation developed in part 2 using a .05 level of significance. After deleting any independent variables that are not significant, develop a new estimated regression equation. 4. Suppose someone claims that “smaller cars provide better values than larger cars.” For the data in this case, the Small Sedans represent the smallest type of car and the Upscale Sedans represent the largest type of car. Does your analysis support this claim? 5. Use regression analysis to develop an estimated regression equation that could be used to predict the value score given the value of the Road-Test Score. 6. Use regression analysis to develop an estimated regression equation that could be used to predict the value score given the Predicted Reliability. 7. What conclusions can you derive from your analysis Toyota Corolla (base, manual) Small Sedan 16,419 0.44 70 4 1.99 Mazda3 i Touring (manual) Small Sedan 18,895 0.50 74 5 1.94 Toyota Corolla LE Small Sedan 18,404 0.47 71 4 1.89 Mazda3 i Touring Small Sedan 19,745 0.52 70 5 1.82 Hyundai Elantra GLS Small Sedan 18,445 0.53 80 3 1.64 Nissan Sentra 2.0 SL Small Sedan 19,750 0.57 74 4 1.51 Ford Focus SE Small Sedan 19,950 0.52 68 2 1.30 Ford Fiesta SE Small Sedan 16,595 0.47 61 2 1.25 Volkswagen Jetta SE (2.5) Small Sedan 20,100 0.54 60 3 1.24 Volkswagen Jetta TDI Small Sedan 25,100 0.50 68 2 1.18 Chevrolet Cruze LS (1.8) Small Sedan 18,375 0.57 67 1 1.04 Chevrolet Cruze 1LT (1.4T) Small Sedan 20,530 0.60 69 1 0.91 Nissan Altima 2.5 S (4-cyl.) Family Sedan 23,970 0.59 91 4 1.75 Kia Optima LX (2.4) Family Sedan 21,885 0.58 81 4 1.73 Subaru Legacy 2.5i Premium Family Sedan 23,830 0.59 83 4 1.73 Ford Fusion Hybrid Family Sedan 32,360 0.63 84 5 1.70 Honda Accord LX-P (4-cyl.) Family Sedan 23,730 0.56 80 4 1.62 Mazda6 i Sport (4-cyl.) Family Sedan 22,035 0.58 73 4 1.60 Hyundai Sonata GLS (2.4) Family Sedan 21,800 0.56 89 3 1.58 Ford Fusion SE (4-cyl.) Family Sedan 23,625 0.57 76 4 1.55 Chevrolet Malibu LT (4-cyl) Family Sedan 24,115 0.57 148 Ford Fusion SEL (V6) Family Sedan 29,500 0.67 142 Nissan Altima 3.5 SR (V6) Family Sedan 30,335 0.69 1.50 Hyundai Sonata Limited (2.0) Family Sedan 28,090 0.66 1.39 Honda Accord EX-L (V6) Family Sedan 28,695 0.67 1.36 Mazda6 s Grand Touring (V6) Family Sedan 30,790 0.74 1.34 Ford Fusion SEL V6, AWD) Family Sedan 30,055 0.71 75 1.32 Subaru Legacy 3.6R Limited Family Sedan 30,094 0.71 1.29 Chevrolet Malibu LTZ (V6) Family Sedan 28,045 0.67 1.20 Chrysler 200 Limited V6 Family Sedan 27,825 0.70 1.20 Chevrolet Impala LT (3.6) Family Sedan 28,995 0.67 1.05 Lexus ES 350 Upscale Sedan 38,615 0.77 91 1.45 Acura TL (base) Upscale Sedan 36,465 0.75 82 1.41 Lexus IS250 Upscale Sedan 33,734 0.75 1.40 Infiniti G25 Journey Upscale Sedan 34,225 0.73 1.37 Lexus HS 250h Premium Upscale Sedan 38,939 0.75 1.36 Acura TSX (4-cyl) Upscale Sedan 29,675 0.67 1.35 Infiniti G37 Journey Upscale Sedan 37,225 0.79 95 1.33 Toyota Avalon Limited Upscale Sedan 35,485 0.73 86 1.27 Volvo S60 T5 Upscale Sedan 35,100 0.76 77 1.18 Nissan Maxima 3.5 SV Upscale Sedan 33,700 0.78 83 1.17 Buick Regal CXL (2.4) Upscale Sedan 28,840 0.65 77 2 1.14 Lincoln MKZ Upscale Sedan 37,160 0.80 77 1.12 BMW 328i Upscale Sedan 39,175 0.79 77 3 1.00 Audi A4 Premium Quattro Upscale Sedan 35,895 0.76 76 1.08 Ford Taurus Limited Upscale Sedan 34,980 0.78 73 1.07 Buick Regal CXL turbo) Upscale Sedan 32,135 0.71 1.06 Mercedes-Benz C300 Sport Upscale Sedan 37,325 0.83 0.95 Volkswagen CC Luxury 2.0T Upscale Sedan 32,680 0.73 82 1.04 Saab 9-3 2.0T Upscale Sedan 31,615 0.70 69 100 Buick LaCrosse CXS (V6) Upscale Sedan 37,555 0.81 0.82 What conclusions can you derive from your analysis?