differences in fuel efficiency figures are normally distributed in the population.
Exercise 3:
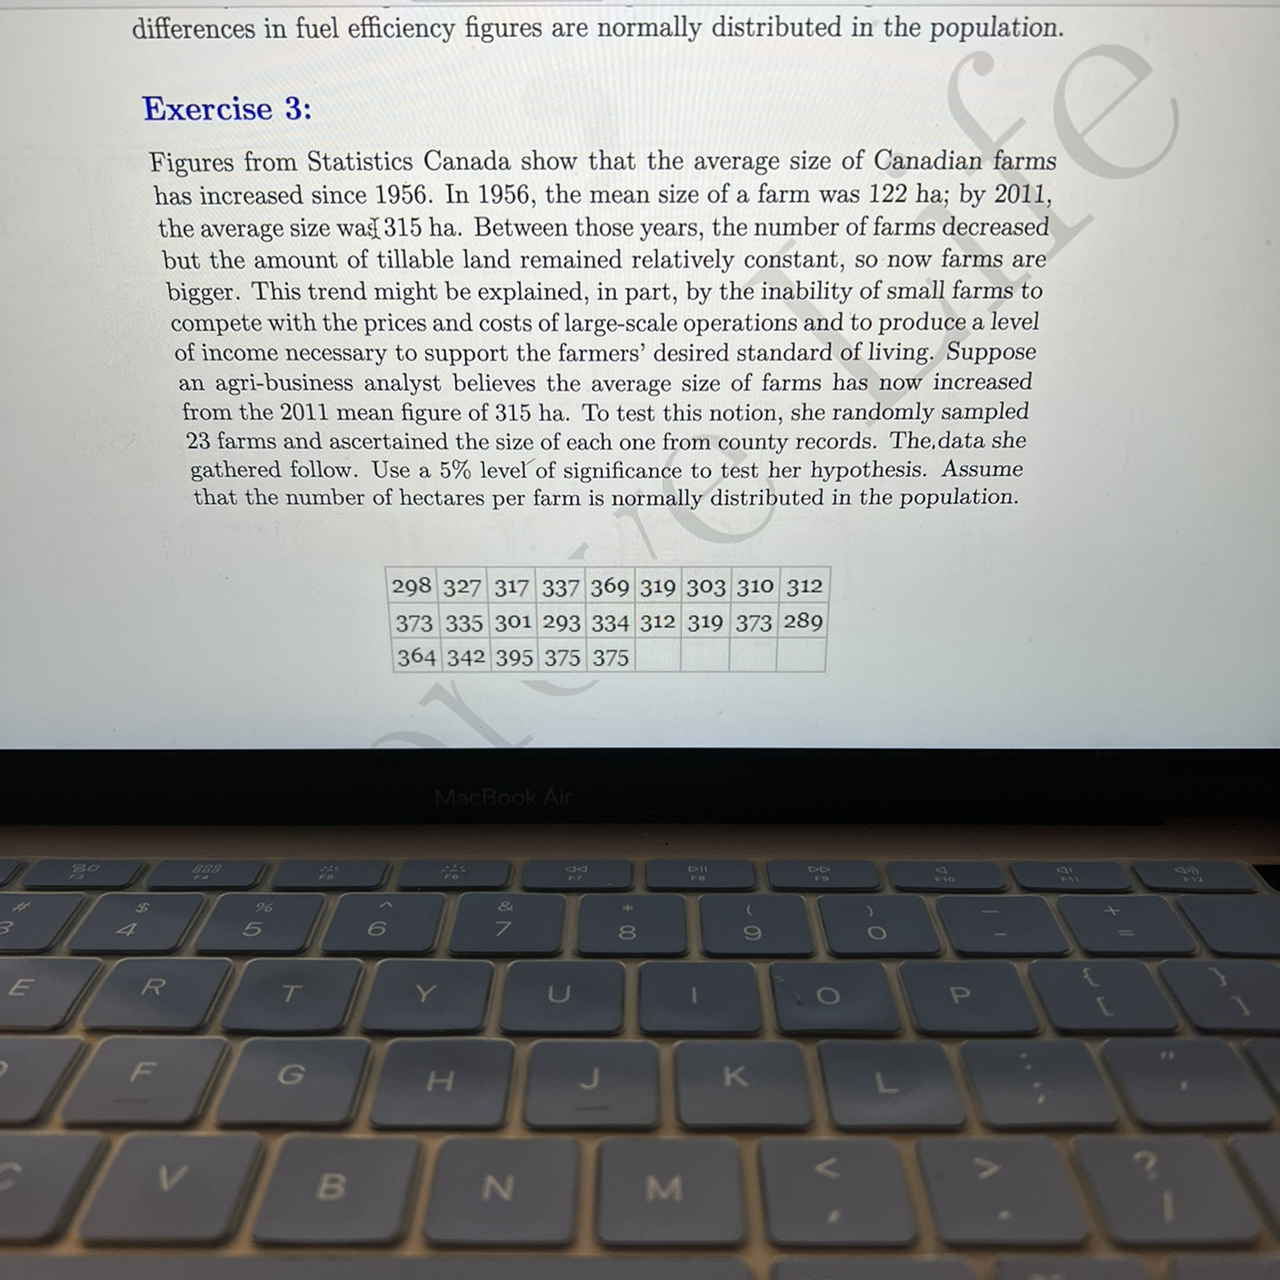
Figures from Statistics Canada show that the average size of Canadian farms has increased since 1956. In 1956, the mean size of a farm was 122 ha; by 2011 , the average size wax 315 ha. Between those years, the number of farms decreased but the amount of tillable land remained relatively constant, so now farms are bigger. This trend might be explained, in part, by the inability of small farms to compete with the prices and costs of large-scale operations and to produce a level of income necessary to support the farmers' desired standard of living. Suppose an agri-business analyst believes the average size of farms has now increased from the 2011 mean figure of 315 ha. To test this notion, she randomly sampled 23 farms and ascertained the size of each one from county records. The,data she gathered follow. Use a \( 5 \% \) level of significance to test her hypothesis. Assume that the number of hectares per farm is normally distributed in the population.
\begin{tabular}{|l|l|l|l|l|l|l|l|l|}
\hline 298 & 327 & 317 & 337 & 369 & 319 & 303 & 310 & 312 \\
\hline 373 & 335 & 301 & 293 & 334 & 312 & 319 & 373 & 289 \\
\hline 364 & 342 & 395 & 375 & 375 & & & & \\
\hline
\end{tabular}