Suppose that, as a researcher, you're interested in the possible interplay between age and face recognition. You choose participants, of whom are in their twenties, of whom are in their thirties, of whom are in their forties, of whom are in their fifties, and of whom are in their sixties. You let each participant examine a collection of photographs of faces of college students. You then test the participant by presenting, on a computer display and one at a time, a sequence of faces (the familiar ones and others). You ask the participant to identify each presented face as being either part of the original collection or not part of the original collection.
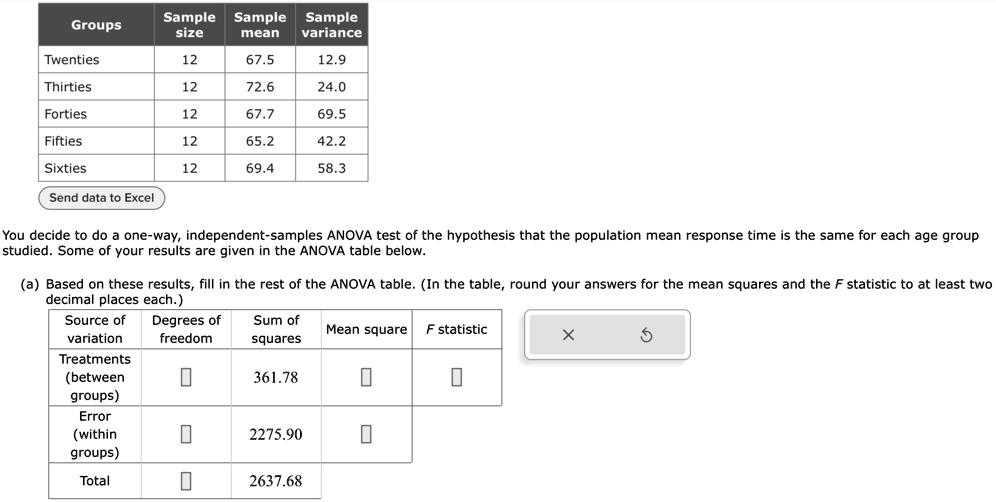
The variable you examine is the total time (in seconds) that a participant takes to make all of her responses. Your data are summarized here.
Then first chart
then (a)
then
(b)Using the 0.05 level of significance, what is the critical value of the F statistic for the ANOVA test? Round your answer to at least two decimal places.
(c)Can you conclude, using the level of significance, that at least one of the population mean total response times differs from the others?
Yes No
Groups
Sample Sample Sample size mean variance
Twenties Thirties Forties Fifties Sixties
12
67.5
12.9
12
72.6 67.7
24.0
12
69.5
12
65.2 69.4
42.2
12
58.3
Send data to Excel
You decide to do a one-way, independent-samples ANOVA test of the hypothesis that the population mean response time is the same for each age group studied. Some of your results are given in the ANOVA table below.
(a) Based on these results, fill in the rest of the ANOVA table.(In the table, round your answers for the mean squares and the F statistic to at least two decimal places each.) Source of Degrees of Sum of Mean square F statistic variation freedom squares X 5 Treatments (between 361.78 groups) Error (within 2275.90 groups) Total 2637.68