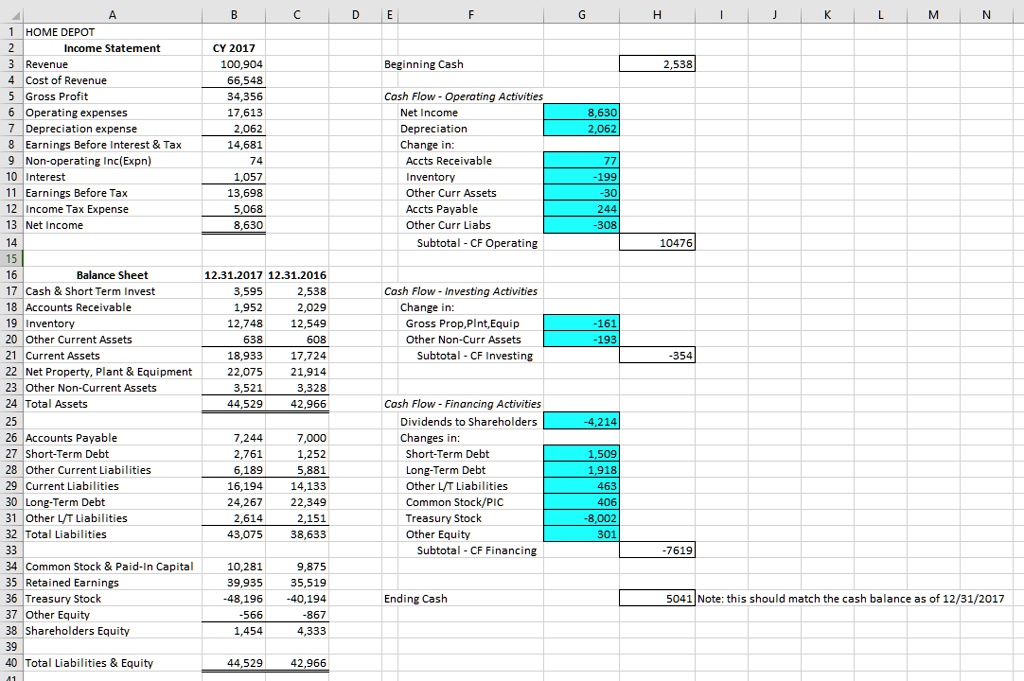
The workbook has a spreadsheet with 2016 and 2017 financial data for Home Depot as well as a template for the Sources & Uses statement. Fill out the numbers in the template boxes (yellow). In the Write Submission box, provide a brief summary (150-250 words) of where the cash flow came from and where it went for calendar year 2017.Fill in the yellow to find the ending cash and write a summary on where the cash flow came and went!
A
B
C
D
G
H
J
K
-
M
N
HOME DEPOT
2
Income Statement
CY 2017 100,904 66,548 34,356 17,613 2,062 14,681 74 1,057 13,698 5,068 8,630
3 Revenue 4 Cost of Revenue 5 Gross Profit 6 Operating expenses 7 Depreciation expense 8 Earnings Before Interest &Tax 9 Non-operating Inc(Expn) 10Interest 11Earnings Before Tax 12Income Tax Expense 13 Net Income 14 15 16 Balance Sheet 12.31.201712.31.2016 17Cash & Short Term Invest 3,595 2,538 18Accounts Receivable 1,952 2,029 19Inventory 12,748 12,549 20Other Current Assets 638 608 21Current Assets 18,933 17,724 22Net Property, Plant & Equipment 22,075 21,914 23Other Non-Current Assets 3,521 3,328 24 Total Assets 44,529 42,966 25 26Accounts Payable 7,244 7,000 27Short-Term Debt 2,761 1,252 28 Other Current Liabilities 6.189 5,881 29Current Liabilities 16,194 14,133 30Long-Term Debt 24,267 22,349 31Other L/T Liabilities 2,614 2,151 32 Total Liabilities 43,075 38,633 33 34Common Stock & Paid-In Capital 10,281 9,875 35 Retained Earnings 39,935 35,519 36Treasury Stock -48,196 -40,194 37Other Equity -566 -867 38 Shareholders Equity 1,454 4,333 39 40Total Liabilities & Equity 44,529 42,966
Beginning Cash
2,538
Cash Flow - Operating Activities Net Income Depreciation Change in: Accts Receivable Inventory Other Curr Assets Accts Payable Other Curr Liabs Subtotal - CF Operating
8,630 2,062
77 -199 -30 244 -308
10476
Cash Flow - Investing Activities Change in: Gross Prop,PInt,Equip Other Non-Curr Assets Subtotal -CF Investing
-161 -193
-354
Cash Flow - Financing Activities Dividends to Shareholders Changes in: Short-Term Debt Long-Term Debt Other L/T Liabilities Common Stock/PIC Treasury Stock Other Equity Subtotal-CF Financing
4,214
1,509 1,918 463 406 -8,002 301
-7619
Ending Cash
5041Note: this should match the cash balance as of 12/31/2017