6. Deriving the short-run supply curve
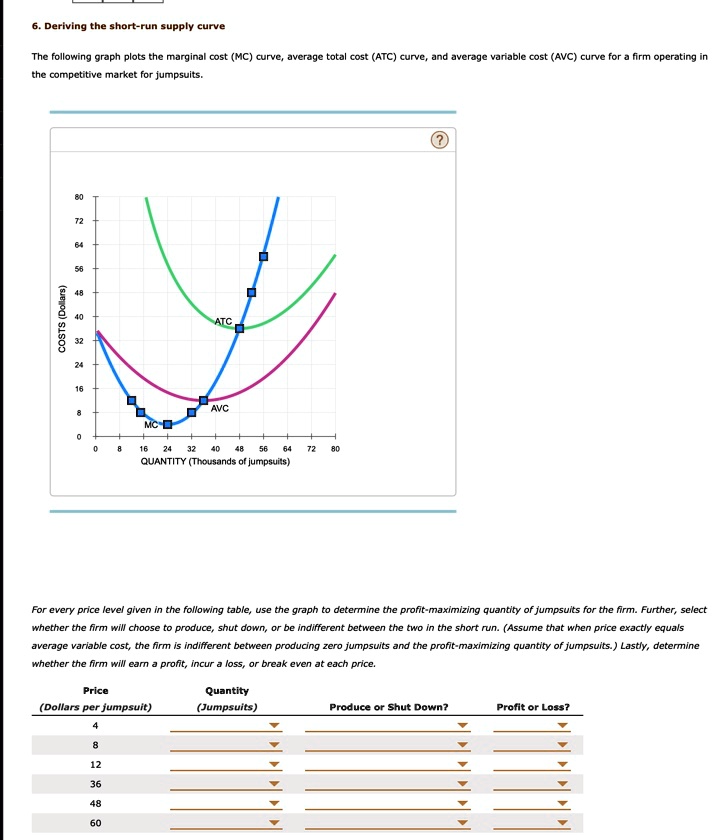
The following graph plots the marginal cost (MC) curve, average total cost (ATC) curve, and average variable cost (AVC) curve for a firm operating in the competitive market for jumpsuits.
COSTS (Dollars)
80
72
64
56
48
40
32
ATC
24
16
8
AVC
MC
0
0 8 16 24 32 40 48 56 64 72 80
QUANTITY (Thousands of jumpsuits)
For every price level given in the following table, use the graph to determine the profit-maximizing quantity of jumpsuits for the firm. Further, select whether the firm will choose to produce, shut down, or be indifferent between the two in the short run. (Assume that when price exactly equals average variable cost, the firm is indifferent between producing zero jumpsuits and the profit-maximizing quantity of jumpsuits.) Lastly, determine whether the firm will earn a profit, incur a loss, or break even at each price.
Price
(Dollars per jumpsuit)
4
8
12
36
48
60
Quantity
(Jumpsuits)
Produce or Shut Down?
Profit or Loss?