Exhibit 3
Comparative Income
Statement-Horizontal
Analysis
QUESTION: Analysis of the financial data in Exhibit 2 and Exhibit 3 shows Lincoln Company turned over its receivables 12.7 times in 20Y6. TRUE OR FALSE
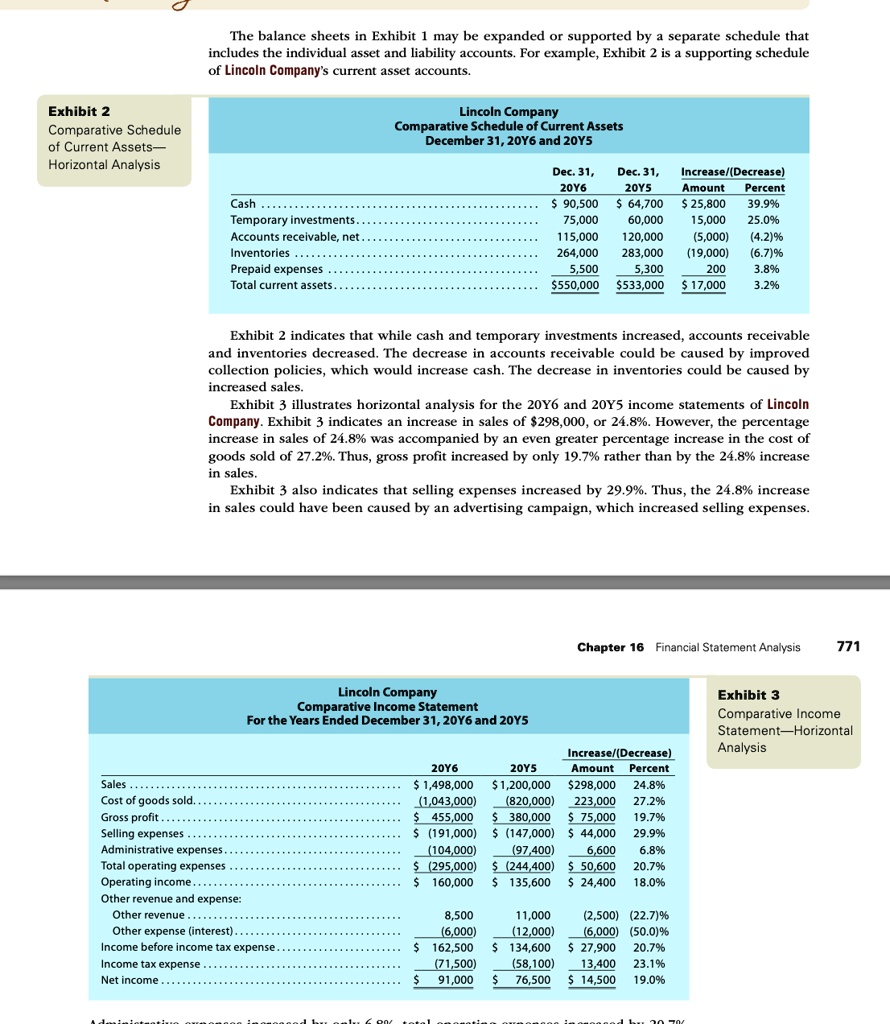
The balance sheets in Exhibit 1 may be expanded or supported by a separate schedule that includes the individual asset and liability accounts. For example, Exhibit 2 is a supporting schedule of Lincoln Company's current asset accounts.
Exhibit 2 Comparative Schedule of Current Assets- Horizontal Analysis
Lincoln Company
Comparative Schedule of Current Assets December31,20Y6and20Y5
Dec.31, Dec.31, Increase/(Decrease) 20Y6 20Y5 Amount Percent $ 90,500 $ 64,700 $ 25,800 39.9% 75,000 60,000 15,000 25.0% 115,000 120,000 (5,000) (4.2)% 264,000 283,000 (19,000) (6.7)% 5,500 5,300 200 3.8% $550,000 $533,000 $17,000 3.2%
Cash... Temporary investments Accounts receivable, net... Inventories.. Prepaid expenses Total current assets. .
Exhibit 2 indicates that while cash and temporary investments increased, accounts receivable and inventories decreased. The decrease in accounts receivable could be caused by improved collection policies, which would increase cash. The decrease in inventories could be caused by increased sales. Exhibit 3 illustrates horizontal analysis for the 20Y6 and 20Y5 income statements of Lincoln Company. Exhibit 3 indicates an increase in sales of $298,000, or 24.8%. However, the percentage increase in sales of 24.8% was accompanied by an even greater percentage increase in the cost of goods sold of 27.2%. Thus, gross profit increased by only 19.7% rather than by the 24.8% increase in sales. Exhibit 3 also indicates that selling expenses increased by 29.9%. Thus, the 24.8% increase in sales could have been caused by an advertising campaign, which increased selling expenses.
Chapter 16 Financial Statement Analysis
771
Lincoln Company
Exhibit 3 Comparative Income Statement-Horizontal Analysis
Comparative Income Statement
For the Years Ended December31,20Y6and 20Y5
Increase/(Decrease) 20Y6 20Y5 Amount Percent $1,498,000 $1,200,000 $298,000 24.8% 1,043,000 (820,000) 223,000 27.2% 455,000 S 380,000 $75,000 19.7% 191,000 $147,000) $44,000 29.9% (104,000) (97,400) 6,600 6.8% 295,000 $ (244,400) $50,600 20.7% 160,000 135,600 $24,400 18.0%
Sales... Cost of goods sold.. Gross profit.. Selling expenses . .. Administrative expenses .. Total operating expenses Operating income.... Other revenue and expense Other revenue..... Other expense (interest)... Income before income tax expense . Income tax expense . . Net income ...
8,500 6,000 162,500 (71,500) 91,000
11,000 (2,500) (22.7)% (12,000) (6,000) (50.0)% 134,600 $ 27,900 20.7% (58,100) 13,400 23.1% 76,500 $14,500 19.0%