Please solve this question (answer all parts and fill in all blanks). Correct answers are shown at the end in blue, I just need to see the processes used to get those results! Positive review will be given for correct answers:)
Question 17 Retaken
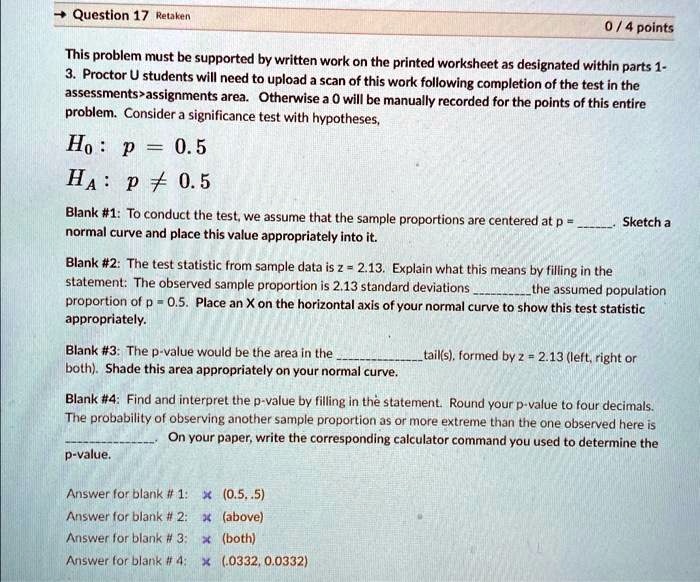
0/4 points This problem must be supported by written work on the printed worksheet as designated within parts 1-3. Proctor U students will need to upload a scan of this work following completion of the test in the assessments>assignments area. Otherwise, a 0 will be manually recorded for the points of this entire problem.
Consider a significance test with hypotheses, Ho: p = 0.5, Ha: p > 0.5
Blank #1: To conduct the test, we assume that the sample proportions are centered at p = 0.5. Sketch a normal curve and place this value appropriately into it.
Blank #2: The test statistic from sample data is z = 2.13. Explain what this means by filling in the statement: The observed sample proportion is 2.13 standard deviations from the assumed population proportion of p = 0.5. Place an X on the horizontal axis of your normal curve to show this test statistic appropriately.
Blank #3: The p-value would be the area in the tail(s) formed by z = 2.13 (left or right or both). Shade this area appropriately on your normal curve.
Blank #4: Find and interpret the p-value by filling in the statement. Round your p-value to four decimals. The probability of observing another sample proportion as or more extreme than the one observed here is 0.0332. On your paper, write the corresponding calculator command you used to determine the p-value.
Answer for blank #1: 0.5
Answer for blank #2: above
Answer for blank #3: both
Answer for blank #4: 0.0332