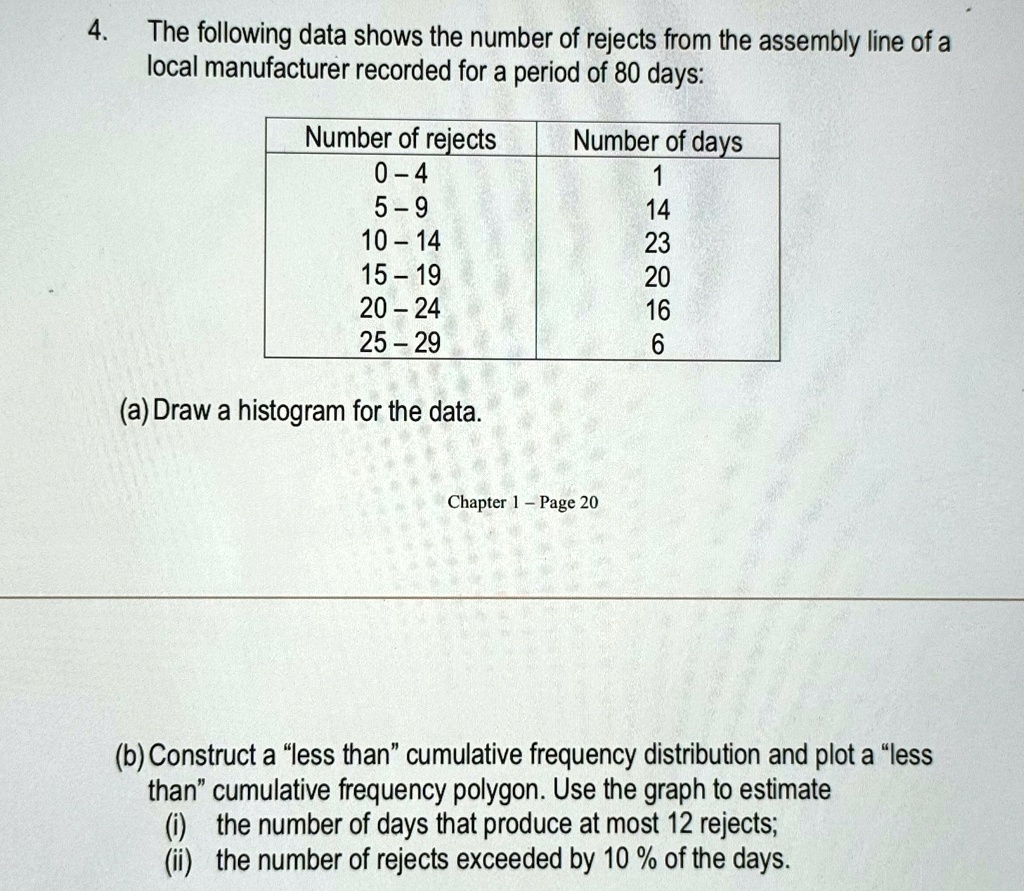
The following data shows the number of rejects from the assembly line of a local manufacturer recorded for a period of 80 days:
able[[Number of rejects,Number of days],[0-4,1],[5-9,14],[10-14,23],[15-19,20],[20-24,16],[25-29,6]]
(a) Draw a histogram for the data.
Chapter 1 - Page 20
(b) Construct a "less than" cumulative frequency distribution and plot a "less than" cumulative frequency polygon. Use the graph to estimate
(i) the number of days that produce at most 12 rejects;
(ii) the number of rejects exceeded by 10% of the days.
4.
The following data shows the number of rejects from the assembly line of a local manufacturer recorded for a period of 80 days
Number of rejects 0-4 5-9 10-14 15-19 20-24 25-29
Number of days 1 14 23 20 16 6
(a)Draw a histogram for the data
Chapter 1-Page20
(b)Construct a "less than" cumulative frequency distribution and plot a "less than"cumulative frequency polygon.Use the graph to estimate (i) the number of days that produce at most 12 rejects; (ii)the number of rejects exceeded by 10 % of the days.