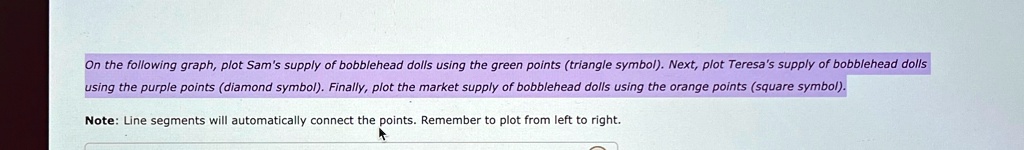
On the following graph, plot Sam's supply of bobblehead dolls using the green points (triangle symbol). Next, plot Teresa's supply of bobblehead dolls using the purple points (diamond symbol). Finally, plot the market supply of bobblehead dolls using the orange points (square symbol).
Note: Line segments will automatically connect the points. Remember to plot from left to right.