Use the graph below to answer the following two questions.
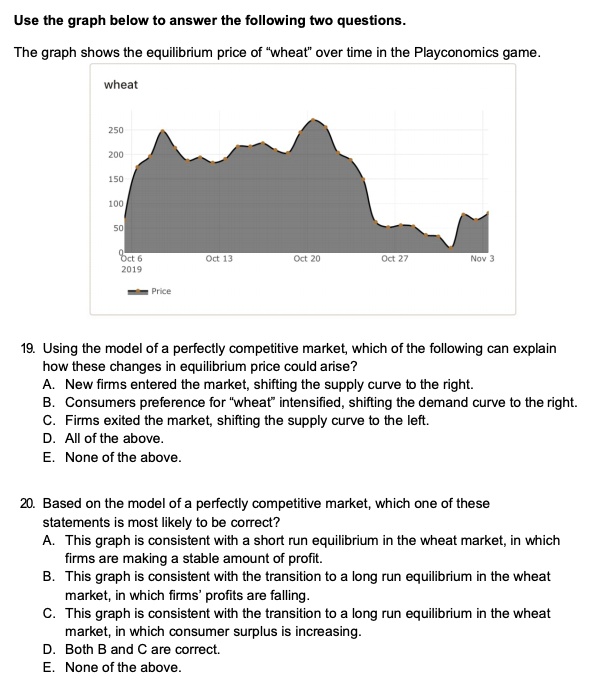
The graph shows the equilibrium price of "wheat" over time in the Playconomics game.
wheat
250
200
150
100
50
Oct 6
2019
Oct 13
Oct 20
Oct 27
Nov 3
Price
19. Using the model of a perfectly competitive market, which of the following can explain
how these changes in equilibrium price could arise?
A. New firms entered the market, shifting the supply curve to the right.
B. Consumers preference for "wheat" intensified, shifting the demand curve to the right.
C. Firms exited the market, shifting the supply curve to the left.
D. All of the above.
E. None of the above.
20. Based on the model of a perfectly competitive market, which one of these
statements is most likely to be correct?
A. This graph is consistent with a short run equilibrium in the wheat market, in which
firms are making a stable amount of profit.
B. This graph is consistent with the transition to a long run equilibrium in the wheat
market, in which firms' profits are falling.
C. This graph is consistent with the transition to a long run equilibrium in the wheat
market, in which consumer surplus is increasing.
D. Both B and C are correct.
E. None of the above.