Spreadsheet Assignment 2
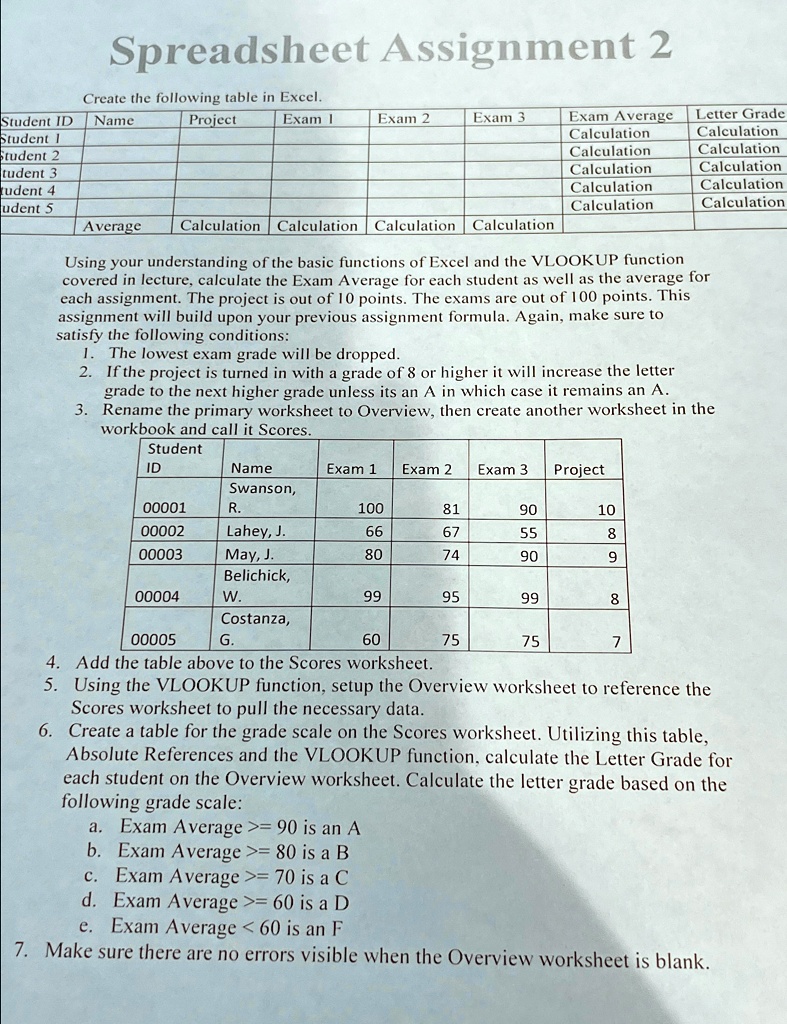
Create the following table in Excel.
able[[Student ID, Name, Project, Exam 1, Exam 2, Exam 3, Exam Average, Letter Grade],[Student 1,,,,,, Calculation, Calculation],[Student 2,,,,, Calculation, Calculation],[Student 3,,,,,, Calculation, Calculation],[Student 4,,,,,, Calculation, Calculation],[Student 5,,,,,, Calculation,],[, Average, Calculation, Calculation, Calculation, Calculation,]]
Using your understanding of the basic functions of Excel and the VLOOKUP function covered in lecture, calculate the Exam Average for each student as well as the average for each assignment. The project is out of 10 points. The exams are out of 100 points. This assignment will build upon your previous assignment formula. Again, make sure to satisfy the following conditions:
The lowest exam grade will be dropped.
If the project is turned in with a grade of 8 or higher it will increase the letter grade to the next higher grade unless it's an A in which case it remains an A.
Rename the primary worksheet to Overview, then create another worksheet in the workbook and call it Scores.
able[[ able[[Student],[ID]], Name, Exam 1, Exam 2, Exam 3, Project],[00001, able[[Swanson,],[R.]], 100, 81, 90, 10],[00002, Lahey, J., 66, 67, 55, 8],[00003, May, J., 80, 74, 90, 9],[, Belichick,, 99, 95, 99, 8],[00004, W.,,,, 75],[, Costanza,, 60, 75, 75, 7]]
Add the table above to the Scores worksheet.
Using the VLOOKUP function, set up the Overview worksheet to reference the Scores worksheet to pull the necessary data.
Create a table for the grade scale on the Scores worksheet. Utilizing this table, Absolute References and the VLOOKUP function, calculate the Letter Grade for each student on the Overview worksheet. Calculate the letter grade based on the following grade scale:
a. Exam Average >= 90 is an A
b. Exam Average >= 80 is a B
c. Exam Average >= 70 is a C
d. Exam Average >= 60 is a D
e. Exam Average < 60 is an F
Make sure there are no errors visible when the Overview worksheet is blank.