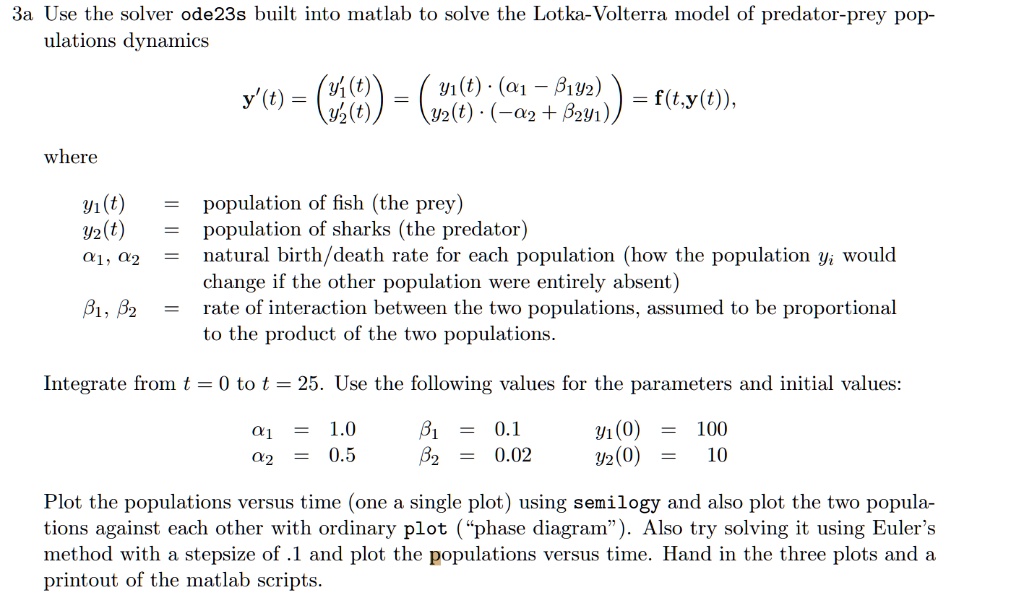
3a Use the solver ode23s built into matlab to solve the Lotka-Volterra model of predator-prey populations dynamics
where
y'(t) = \begin{pmatrix} y_1(t) \\ y_2(t) \end{pmatrix} = \begin{pmatrix} y_1(t) \cdot (\alpha_1 - \beta_1 y_2) \\ y_2(t) \cdot (-\alpha_2 + \beta_2 y_1) \end{pmatrix} = f(t, y(t)),
y_1(t) = population of fish (the prey)
y_2(t) = population of sharks (the predator)
\alpha_1, \alpha_2 = natural birth/death rate for each population (how the population $y_i$ would
change if the other population were entirely absent)
\beta_1, \beta_2 = rate of interaction between the two populations, assumed to be proportional
to the product of the two populations.
Integrate from t = 0 to t = 25. Use the following values for the parameters and initial values:
\alpha_1 = 1.0
\alpha_2 = 0.5
\beta_1 = 0.1
\beta_2 = 0.02
y_1(0) = 100
y_2(0) = 10
Plot the populations versus time (one a single plot) using semilogy and also plot the two populations against each other with ordinary plot ("phase diagram"). Also try solving it using Euler's method with a stepsize of .1 and plot the populations versus time. Hand in the three plots and a printout of the matlab scripts.