Ace - AI Tutor
Ask Our Educators
Textbooks
My Library
Flashcards
Scribe - AI Notes
Notes & Exams
Download App
Jasmine

Jasmine

Divider

Questions asked

INSTANT ANSWER

17.core.learn.edgenulty.com/player/ dschooli.org trockmarks Classes SIS K-12 360 Launch ndations of Algebra 52 In the diagram, the measure of angle 3 is \( (23 x)^{\circ} \), and the measure of angle 4 is \( (7 x)^{\circ} \). What is the measure of angle 4 ? \( 30^{\circ} \) \( 42^{\circ} \) \( 120^{\circ} \) Mark this and return Save and Exit Next Submit Desk 1

View Answer
divider
INSTANT ANSWER

\( \begin{array}{l}r=\frac{n \sum x y-\sum x \sum y}{\sqrt{\left[n \sum x^{2}-\left(\sum x\right)^{2}\right]\left[\Sigma y^{2}-(\Sigma, y)^{2}\right]}} \\ r=\frac{9787-76(591)}{\sqrt{\left.1420-(76)^{2}\right]\left[72,421-(591)^{2}\right]}}\end{array} \)

View Answer
divider
INSTANT ANSWER

webasslgn.net/web/Student/Assignment-Responses/last?dep \( =33426115 \) Slisterss sithers whels Barist Paham Answar 10. \( [-/ 3 \) Points] DETAILS MY NOTES PECKDEVSTAT7 12,E.014. ASK YOUR TEACHER PRACTICE ANOTHER 
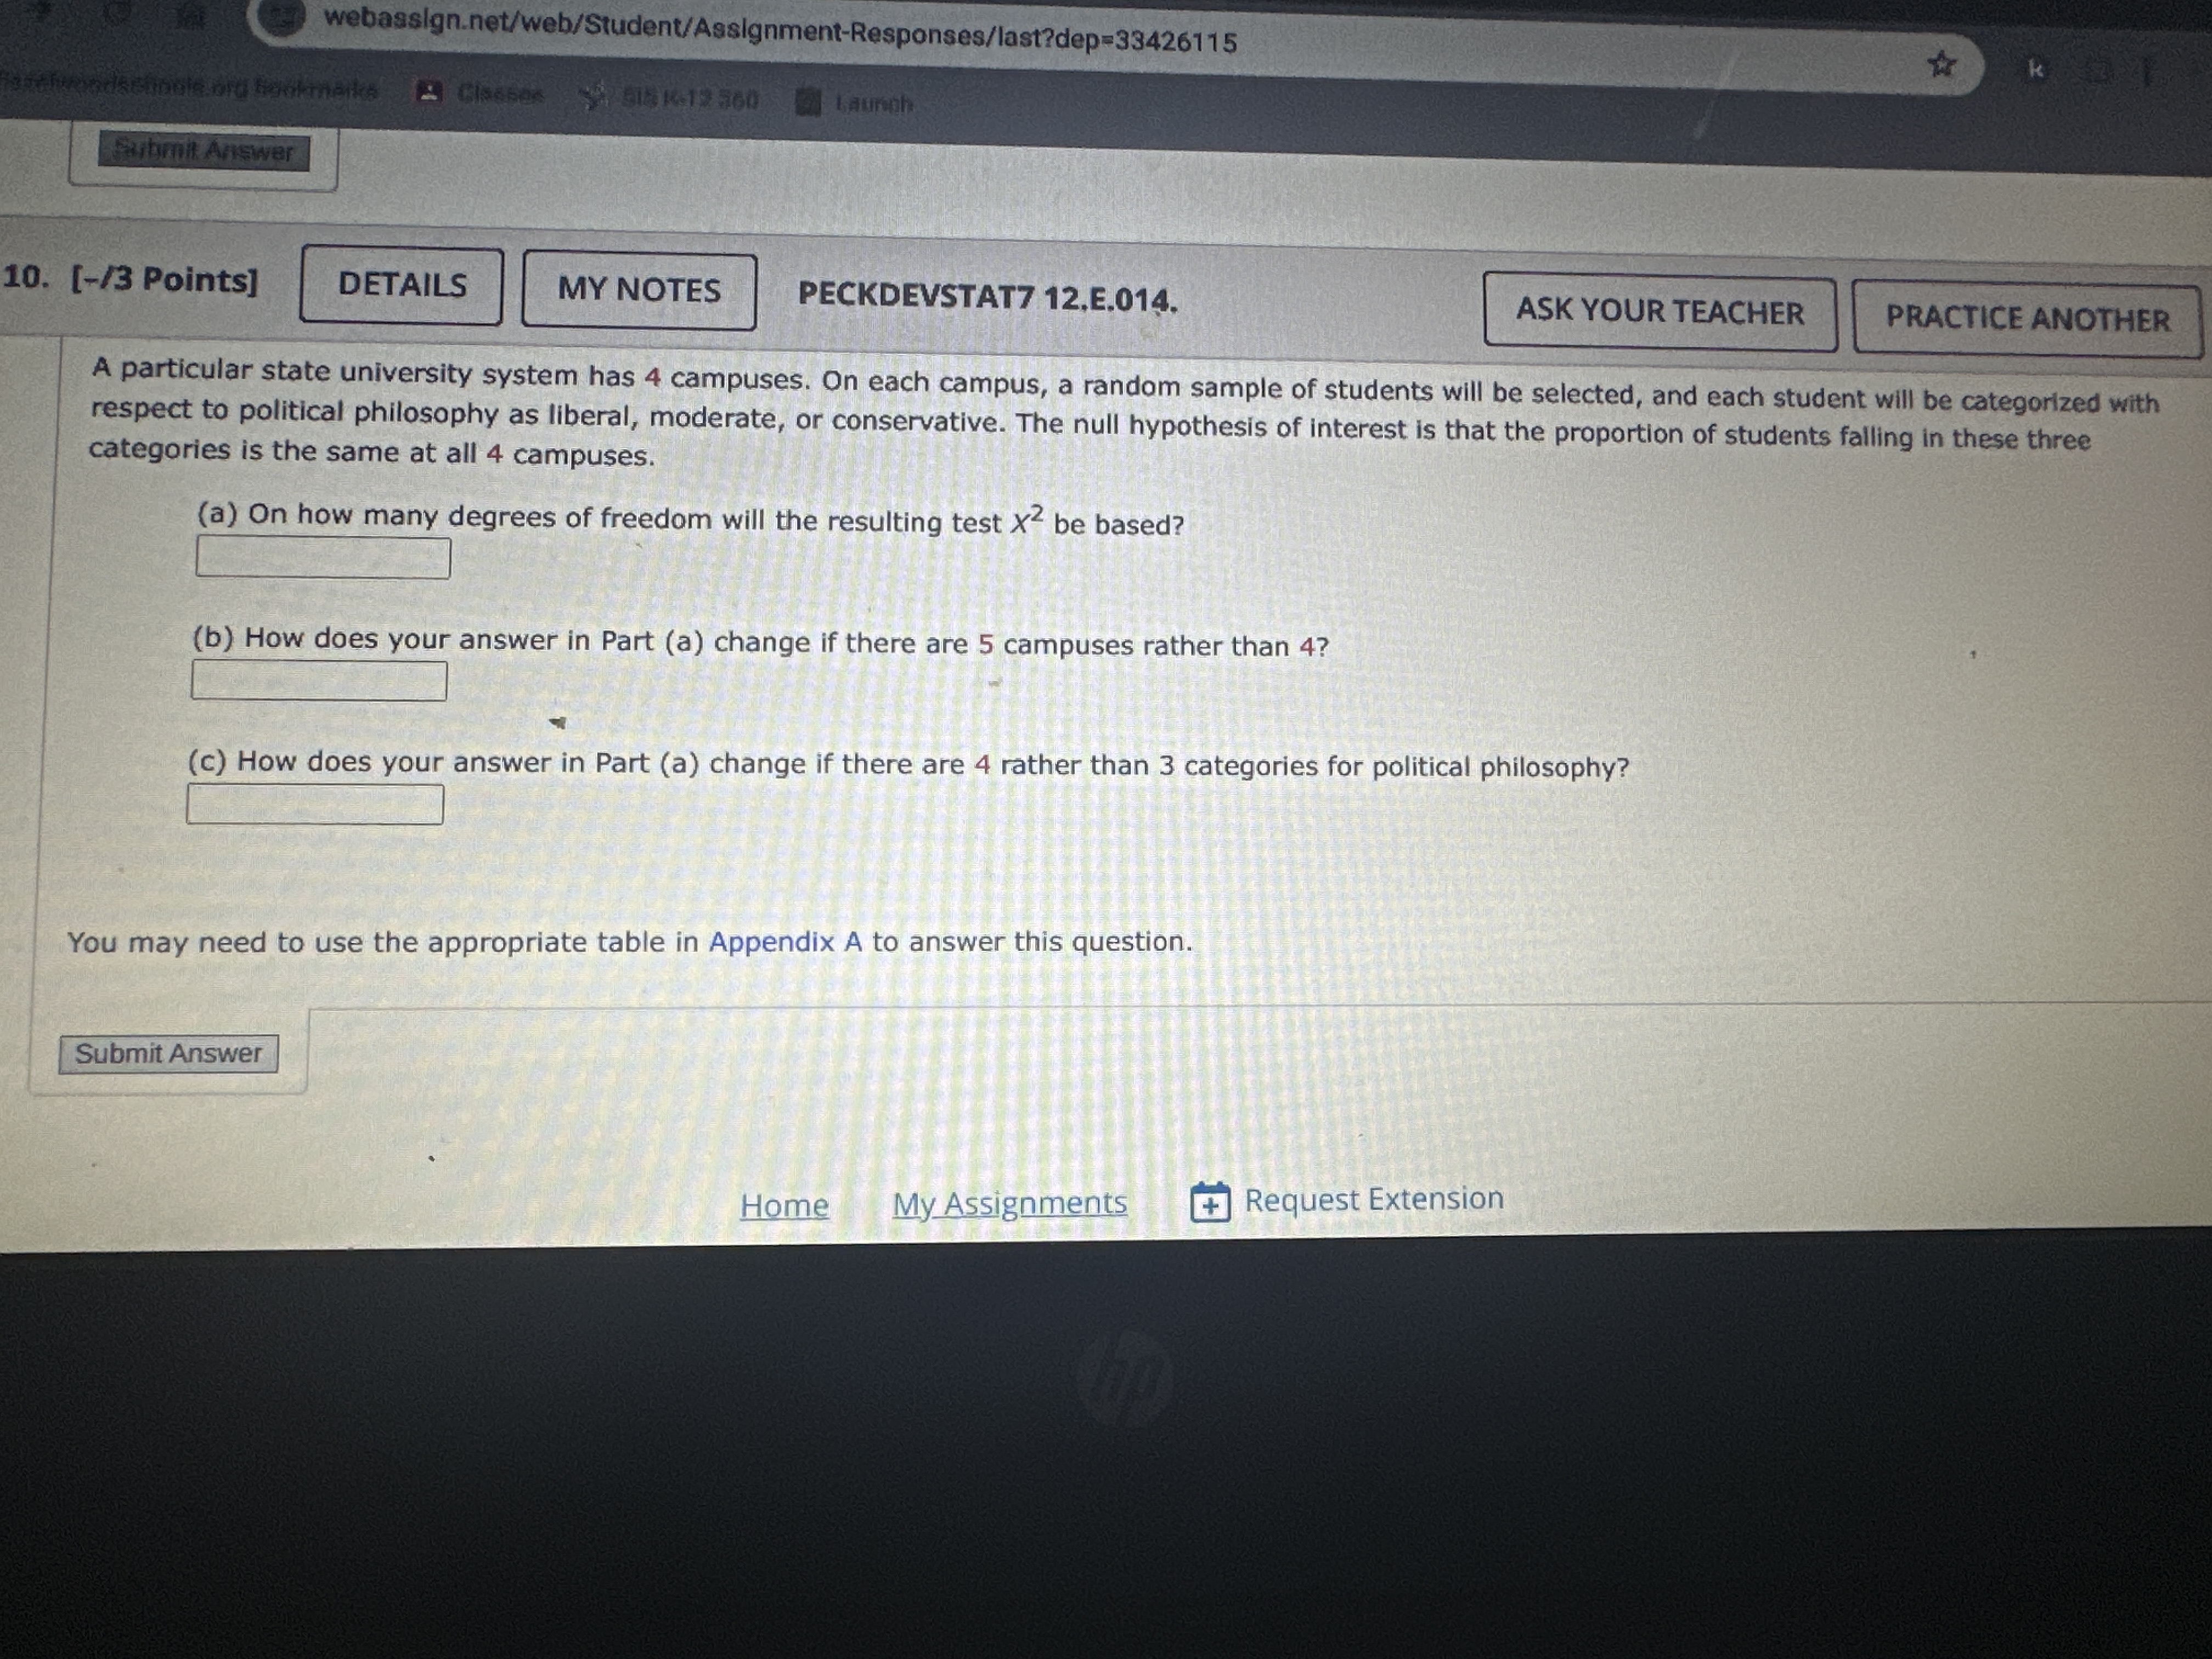
A particular state university system has 4 campuses. On each campus, a random sample of students will be selected, and each student will be categorized with respect to political philosophy as liberal, moderate, or conservative. The null hypothesis of interest is that the proportion of students falling in these three categories is the same at all 4 campuses. (a) On how many degrees of freedom will the resulting test \( x^{2} \) be based? \( \square \) (b) How does your answer in Part (a) change if there are 5 campuses rather than 4 ? \( \square \) (c) How does your answer in Part (a) change if there are 4 rather than 3 categories for political philosophy? \( \square \) You may need to use the appropriate table in Appendix A to answer this question. Submit Answer Home My Assignments Request Extension

View Answer
divider
INSTANT ANSWER

webassign.net/web/Student/Assignment-Responses/submit?dep=33426115\&tags=autosave\#question4927711_5 PREVIOUS ANSWERS classea SIS K-12360 Launch ASK YOUR TEACHER PRACTICE ANOTHER An article about the California lottery gave the following information on the age distribution of adults in California: \( 35 \% \) are between 18 and 34 years old, \( 51 \% \) are between 35 and 64 years old, and \( 14 \% \) are 65 years old or older. The article also gave information on the age distribution of those who purchase lottery tickets. The following table is consistent with the values given in the article. Suppose that the data resulted from a random sample of 200 lottery ticket purchasers. Based on these sample data, is it reasonable to conclude that one or more of these three age groups buys a disproportionate share of lottery tickets? Use a chi-square goodness-of-fit test with \( \alpha=0.05 \). (Round your answer to two decimal places.) \begin{tabular}{|l|c|} \hline Age of Purchaser & Frequency \\ \hline \( 18-34 \) & 38 \\ \hline \( 35-64 \) & 105 \\ \hline 65 and over & 57 \\ \hline \end{tabular} \( \chi^{2}= \) \( \square \) \( P \)-value interval \( p<0.001 \) \( 0.001 \leq p<0.01 \) \( 0.01 \leq p<0.05 \) \( 0.05 \leq p<0.10 \) \( p \geq 0.10 \) The data \( \square \) provide strong evidence to conclude that one or more of the three age groups buys a disproportionate share of lottery tickets.

View Answer
divider
INSTANT ANSWER

webassign.net/web/Student/Assignment-Responses/submit?dep=33426115\&tags=autosave\#question4927698_4 Classes SISK-12360 Launch The director of library services at a college did a survey of types of books (by subject) in the circulation library. Then she used library records to take a random sample of 888 books checked out last term and classified the books in the sample by subject. The results are shown below. \begin{tabular}{|ccc|} \hline Subject Area & \begin{tabular}{c} Percent of Books on Subject in Circulation \\ Library on This Subject \end{tabular} & \begin{tabular}{c} Number of Books in \\ Sample on This Subject \end{tabular} \\ \hline Business & \( 32 \% \) & 268 \\ Humanities & \( 25 \% \) & 212 \\ Natural Science & \( 20 \% \) & 223 \\ Social Science & \( 15 \% \) & 108 \\ All other subjects & \( 8 \% \) & 77 \\ \hline \end{tabular} \( \Omega \) USE SALT Using a \( 5 \% \) level of significance, test the claim that the subject distribution of books in the library fits the distribution of books checked out by students. (a) What is the level of sighificance? \( \square \) State the null and alternate hypotheses. \( H_{0} \) : The distributions are different. \( H_{1} \) : The distributions are the same. \( H_{0} \) : The distributions are different. \( H_{1} \) : The distributions are different. \( \mathrm{H}_{0} \) : The distributions are the same. \( H_{1} \) : The distributions are different.

View Answer
divider
INSTANT ANSWER

The types of browse favored by deer are shown in the following table. Using binoculars, volunteers observed the feeding habits of a random sample of 320 deer \begin{tabular}{|lcc|} \hline Type of Browse & \begin{tabular}{c} Plant Composition \\ In Study Area \end{tabular} & \begin{tabular}{c} Observed Number of Deer \\ Feeding on This Plant \end{tabular} \\ \hline Sage brush & \( 32 \% \) & 99 \\ Rabbit brush & \( 38.7 \% \) & 125 \\ Salt brush & \( 12 \% \) & 46 \\ Service berty & \( 9.3 \% \) & 31 \\ Other & \( 8 \% \) & 19 \\ \hline \end{tabular} USE SALT Use a \( 5 \% \) level of significance to test the claim that the natural distribution of browse fits the deer feeding pattern. (a) What is the level of significance? \( \square \) State the null and alternate hypotheses. \( H_{0} \) : The distributions are the same. \( H_{1} \) : The distributions are different. \( H_{0} \) : The distributions are different. \( H_{1} \) : The distributions are the same. \( H_{0} \) : The distributions are the same. \( H_{1} \) : The distributions are the same. \( H_{0} \) : The distributions are different. H. : The distributions are different.

View Answer
divider
INSTANT ANSWER

The type of household for the U.S. population and for a random sample of 411 households from a community in Montana are shown below. \begin{tabular}{|c|c|c|} \hline Type of Household & \begin{tabular}{c} Percent of U.S. \\ Households \end{tabular} & \begin{tabular}{c} Observed Number \\ of Households in \\ the Community \end{tabular} \\ \hline Married with children & \( 26 \% \) & 104 \\ \hline Married, no children & \( 29 \% \) & 117 \\ \hline Single parent & \( 9 \% \) & 29 \\ \hline One person & \( 25 \% \) & 94 \\ \hline Other (e.g., roommates, siblings) & \( 11 \% \) & 67 \\ \hline \end{tabular} \( \Omega \) USE SALT Use a \( 5 \% \) level of significance to test the claim that the distribution of U.S. households fits the Dove Creek distribution. (a) What is the level of significance? \( \square \) State the null and alternate hypotheses. \( H_{0} \) : The distributions are different. \( H_{1} \) : The distributions are the same.

View Answer
divider
INSTANT ANSWER

After a large fund drive to help the Boston City Library, the following information was obtained from a random sample of contributors to the library fund. Using a \( 1 \% \) level of significance, test the claim that the amount contributed to the library fund is independent of ethnic group. \begin{tabular}{|l|c|c|c|c|c|c|} \hline & \multicolumn{6}{c}{ Number of People Making Contribution } \\ \cline { 2 - 6 } Ethnic Group & \( \mathbf{\$ 1 - 5 0} \) & \( \mathbf{\$ 1 - 1 0 0} \) & \( \mathbf{\$ 1 0 1 - 1 5 0} \) & \( \mathbf{\$ 1 5 1 - 2 0 0} \) & Over \( \mathbf{\$ 2 0 0} \) & Row Total \\ \hline A & 81 & 67 & 44 & 40 & 19 & 251 \\ \hline B & 100 & 55 & 56 & 30 & 23 & 264 \\ \hline C & 81 & 60 & 52 & 40 & 33 & 266 \\ \hline D & 105 & 81 & 64 & 58 & 32 & 340 \\ \hline Column Total & 367 & 263 & 216 & 168 & 107 & 1121 \\ \hline \end{tabular} USE SALT (a) What is the level of significance? \( \square \) State the null and alternate hypotheses. \( H_{0}: \) Contribution level and ethnic group are not independent. \( H_{1} \) : Contribution level and ethnic group are not independent. \( H_{0} \) : Contribution level and ethnic group are independent. \( H_{1} \) : Contribution level and ethnic group are independent. \( H_{0} \) : Contribution level and ethnic group are independent. \( H_{1} \) : Contribution level and ethnic group are not independent. \( H_{0} \) : Contribution level and ethnic group are not independent. \( H_{1} \) : Contribution level and ethnic group are independent.

View Answer
divider
INSTANT ANSWER

The following table shows ceremonial ranking and type of pottery sherd for a random sample of 434 sherds at an archaeological location. \begin{tabular}{|c|c|c|c|} \hline Ceremonial Ranking & Cooking Jar Sherds & \begin{tabular}{c} Decorated Jar Sherds \\ (Noncooking) \end{tabular} & Row Total \\ \hline A & 89 & 46 & 135 \\ \hline B & 95 & 50 & 145 \\ \hline C & 78 & 76 & 154 \\ \hline Column Total & 262 & 172 & 434 \\ \hline \end{tabular} \( \Omega \) USE SALT Use a chi-square test to determine if ceremonial ranking and pottery type are independent at the 0.05 level of significance. (a) What is the level of significance? \( \square \) State the null and alternate hypotheses. \( H_{0} \) : Ceremonial ranking and pottery type are not independent. \( H_{1} \) : Ceremonial ranking and pottery type are not independent. \( H_{0} \) : Ceremonial ranking and pottery type are independent. \( H_{1} \) : Ceremonial ranking and pottery type are not independent. \( H_{0} \) : Ceremonial ranking and pottery type are not independent. \( H_{1} \) : Ceremonial ranking and pottery type are independent.

View Answer
divider
INSTANT ANSWER

webassign.net/web/Student/Assignment-Responses/last?dep \( =33426115 \) \#question3780162_6 hazeltwoodschools. org toolkmariss Classes SISK-12360 Launch The following table shows the Myers-Briggs personality preferences for a random sample of 519 people in the listed professions. T refers to thinking and \( \mathrm{F} \) refers to feeling. \begin{tabular}{|c|c|c|c|} \hline \multirow[b]{2}{*}{ Occupation } & \multicolumn{2}{|c|}{ Personality Type } & \multirow[b]{2}{*}{ Row Total } \\ \hline & \( \mathbf{T} \) & F & \\ \hline Clergy (all denominations) & 55 & 93 & 148 \\ \hline M.D. & 81 & 78 & 159 \\ \hline Lawyer & 116 & 96 & 212 \\ \hline Column Total & 252 & 267 & 519 \\ \hline \end{tabular} \( \Omega \) USE SALT Use the chi-square test to determine if the listed occupations and personality preferences are independent at the 0.01 level of significance. (a) What is the level of significance? \( \square \) State the null and alternate hypotheses. \( H_{0}: \) Myers-Briggs preference and profession are independent. \( H_{1} \) : Myers-Briggs preference and profession are not independent. \( H_{0} \) : Myers-Briggs preference and profession are not independent. \( \mathrm{H}_{1} \) : Myers-Briggs preference and profession are independent. \( H_{0} \) : Myers-Briggs preference and profession are not independent. \( \mathrm{H}_{1} \) : Myers-Briggs preference and profession are not independent. \( H_{n}: \) Myers-Briggs preference and profession are independent.

View Answer
divider