Question 12 (2 points)
10
A
8
Corn
B
(millions
of bushels)
6
C
4
ppc corn and coffee
D
2
0
1
2
3
4
5
Coffee
(millions of bushels)
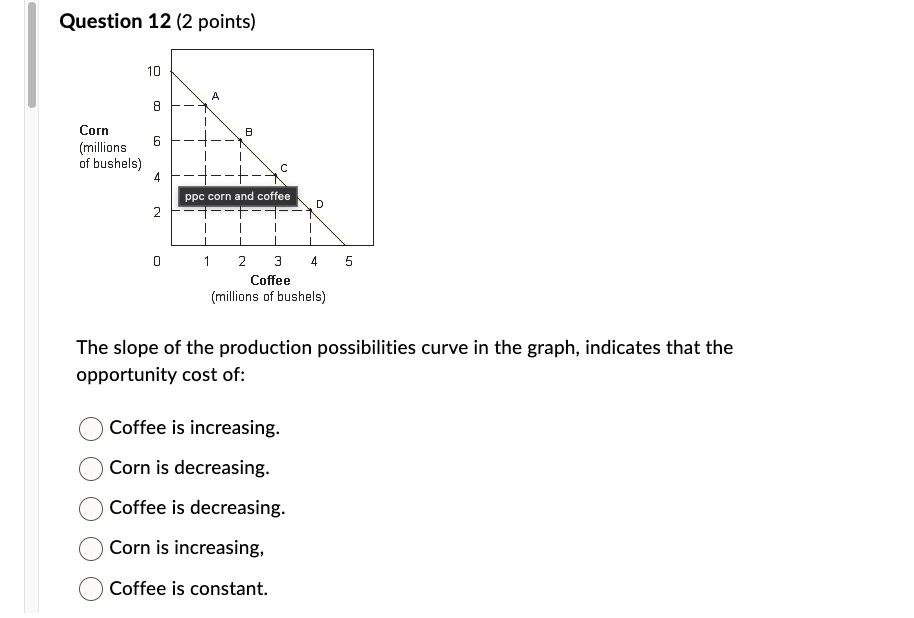
The slope of the production possibilities curve in the graph, indicates that the
opportunity cost of:
Coffee is increasing.
Corn is decreasing.
Coffee is decreasing.
Corn is increasing,
Coffee is constant.