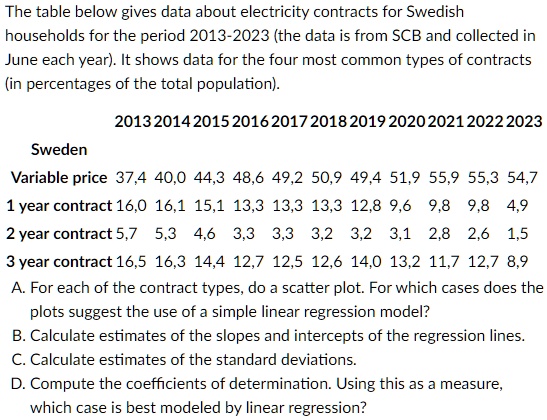
The table below gives data about electricity contracts for Swedish
households for the period 2013-2023 (the data is from SCB and collected in
June each year). It shows data for the four most common types of contracts
(in percentages of the total population).
Sweden
2013 2014 2015 2016 2017 2018 2019 2020 2021 2022 2023
Variable price 37,4 40,0 44,3 48,6 49,2 50,9 49,4 51,9 55,9 55,3 54,7
1 year contract 16,0 16,1 15,1 13,3 13,3 13,3 12,8 9,6 9,8 9,8 4,9
2 year contract 5,7 5,3 4,6 3,3 3,3 3,2 3,2 3,1 2,8 2,6 1,5
3 year contract 16,5 16,3 14,4 12,7 12,5 12,6 14,0 13,2 11,7 12,7 8,9
A. For each of the contract types, do a scatter plot. For which cases does the
plots suggest the use of a simple linear regression model?
B. Calculate estimates of the slopes and intercepts of the regression lines.
C. Calculate estimates of the standard deviations.
D. Compute the coefficients of determination. Using this as a measure,
which case is best modeled by linear regression?