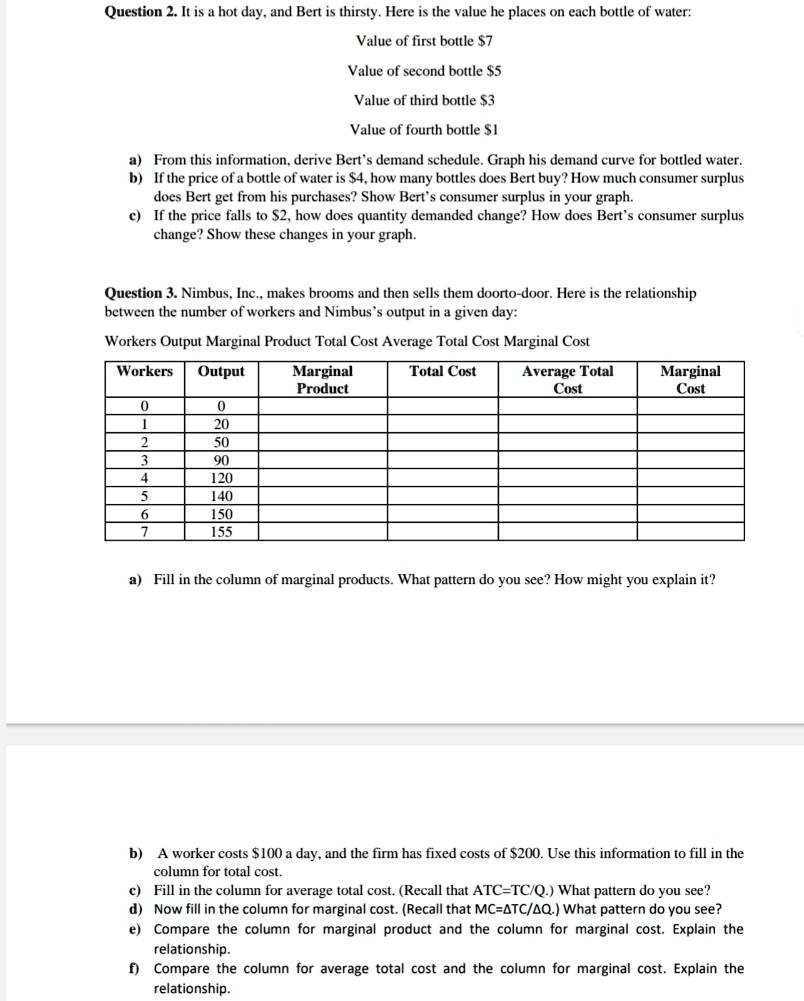
Question 2. It is a hot day, and Bert is thirsty. Here is the value he places on each bottle of water:
Value of first bottle: $7
Value of second bottle: $5
Value of third bottle: $3
Value of fourth bottle: $1
a) From this information, derive Bert's demand schedule. Graph his demand curve for bottled water.
b) If the price of a bottle of water is $4, how many bottles does Bert buy? How much consumer surplus does Bert get from his purchases? Show Bert's consumer surplus in your graph.
c) If the price falls to $2, how does quantity demanded change? How does Bert's consumer surplus change? Show these changes in your graph.
Question 3. Nimbus, Inc., makes brooms and then sells them door-to-door. Here is the relationship between the number of workers and Nimbus's output in a given day:
Workers | Output | Marginal Product | Total Cost | Average Total Cost | Marginal Cost
------- | ------ | ---------------- | ---------- | ------------------ | -------------
0 | 20 | | | |
1 | 50 | | | |
2 | 90 | | | |
3 | 120 | | | |
4 | 140 | | | |
5 | 150 | | | |
6 | 155 | | | |
a) Fill in the column of marginal products. What pattern do you see? How might you explain it?
b) A worker costs $100 a day and the firm has fixed costs of $200. Use this information to fill in the column for total cost.
c) Fill in the column for average total cost. (Recall that ATC = TC/Q.) What pattern do you see?
d) Now fill in the column for marginal cost. (Recall that MC = ATC/Q.) What pattern do you see?
e) Relationship.
f) Compare the column for average total cost and the column for marginal cost. Explain the relationship.