Ace - AI Tutor
Ask Our Educators
Textbooks
My Library
Flashcards
Scribe - AI Notes
Notes & Exams
Download App
jeffrey dickerson

jeffrey d.

Divider

Questions asked

BEST MATCH

What's the difference between the types of bias? Intentional and Unintentional in AI

View Answer
divider
BEST MATCH

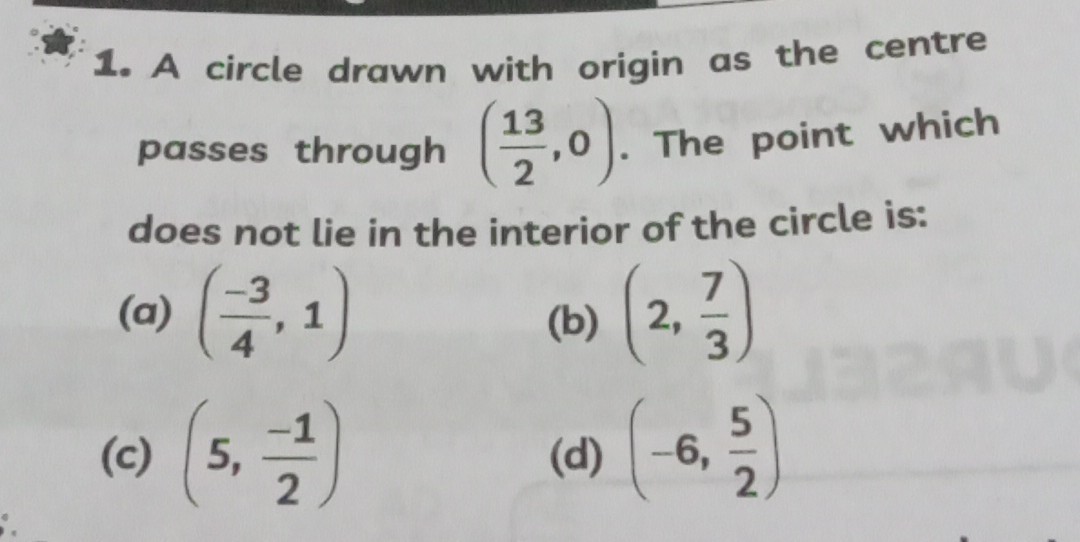
1. A circle drawn with origin as the centre passes through \( \left(\frac{13}{2}, 0\right) \). The point which does not lie in the interior of the circle is: (a) \( \left(\frac{-3}{4}, 1\right) \) (b) \( \left(2, \frac{7}{3}\right) \) (c) \( \left(5, \frac{-1}{2}\right) \) (d) \( \left(-6, \frac{5}{2}\right) \)
View Answer
divider
BEST MATCH

Suppose that the table shows market share data for all of the sushi restaurants in town. Calculate the Herfindahl-Hirschman index (HHI) for the local sushi market. HHI: Restaurant Market Share (%) Ahi Sushi 35 Shizuoka 35 Yoshinos 15 Ono Sushi 10 Arigato 5

View Answer
divider
BEST MATCH

On the NASDAQ system, the inside quotes are the: Multiple Choice highest bid and highest ask. lowest ask and lowest bid. prices at which the top company executives can trade the stock. lowest bid and highest ask. highest bid and lowest ask.

View Answer
divider
BEST MATCH

Take Sample 17 6.875 deviation 2.012 Enter the values of the sample size, the point estimate of the mean, the sample standard deviation, and the critical value you need for your 90% confidence interval. (Choose the correct critical value from the table of critical values provided.) When you are done, select "Compute". Sample size: X 5 Standard error: Point estimate: Sample standard deviation: Margin of error: Confidence Critical value level Critical value: 99% $t_{0.005} = 2.921$ 90% confidence interval: 95% $t_{0.025} = 2.120$ Compute 90% $t_{0.050} = 1.746$ ) Based on your sample, enter the lower and upper limits to graph the 90% confidence interval for the population mean of all the numbers of hours slept by college students the night before finals. 0.000 90% confidence interval: 10.000 Save For Later

View Answer
divider
BEST MATCH

14. File asafellow.csv contains the data described in Example 3.7. There are 18 strata, defined by the cross-classification of variables awardyr and gender. (a) Calculate the sampling weight for each member of the sample. Is the sample exactly self-weighting? (b) Estimate the proportion of Fellows who work in academia. In 2020, approximately 48% of the population of ASA members worked in academia. Does your 95% CI include the value 0.48? (c) Estimate the proportion of Fellows who majored in mathematics as undergraduates, along with its standard error. Use the same method as in Example 3.4 to deal with the missing data.

View Answer
divider
BEST MATCH

3. State the domain of the function \(f(t) = \frac{1}{1 - t^2}\)

View Answer
divider
BEST MATCH

Which of the following is the proper procedure for performing a test for lactose tolerance?

View Answer
divider
BEST MATCH

4) Given the following edge-weighted graph and Bellman-Ford's algorithm, answer the following questions to find the shortest paths from vertex 3 to all other nodes 3 7 3 1 2 4 5 4 6 -1 5 2 2 1 -2 6 d) What are the finishing times of all nodes on the graph? Consider the numeric order. e) Give the order in which the vertices whose shortest paths are discovered. List the shortest distance distTo[u] (from the source to u) and parent[u] for those vertices. f) What data structures are needed and what is the running time of this algo- rithm? g) Is this a greedy algorithm?

View Answer
divider
BEST MATCH

3. Calculate the U-factor of the 2 by 4 stud wall shown above. The studs are 16 in. OC (off-center). There is 3.5 in. mineral fiber batt insulation (R-13) in the stud space. The inside finish is 0.5 in. gypsum wall board; the outside is finished with rigid foam insulating sheathing (R-4) and 0.5 in. by 8 in. wood bevel lapped siding. The insulated cavity occupies approximately 75% of the transmission area; the studs, plates, and sills occupy 21%; and the headers occupy 4%. Remember that 2 x 4 studs are actually 1½ x 3½. If the outside conditions are 20 F and 70% humidity while the inside conditions are 70 F and 50% humidity, where is the most likely location for condensation to form? 1. Outside surface 2. Wood bevel lapped siding 3. Sheathing (rigid foam insulation) 4. Mineral fiber batt insulation 5. Wood Stud 6. Gypsum Wallboard 7. Inside Surface

View Answer
divider