d. What other mathematical fact or facts can you interpret from the graph? (Choose from words like increasing, decreasing, rate, faster, slower, than in your answer and use a number fact.)
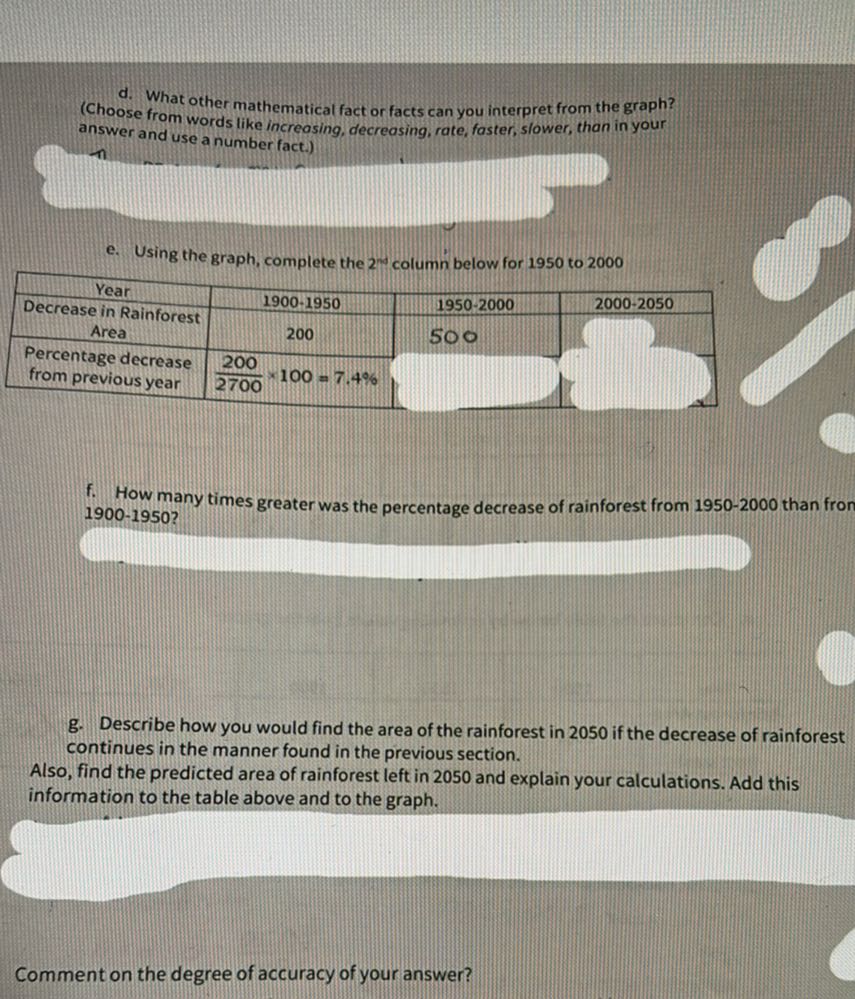
e. Using the graph, complete the \( 2^{\text {d }} \) column below for 1950 to 2000
\begin{tabular}{|c|c|c|c|}
\hline \begin{tabular}{c}
Year \\
Decrease in Rainforest
\end{tabular} & \( 1900-1950 \) & \( 1950-2000 \) & \( 2000-2050 \) \\
\hline \begin{tabular}{l}
Percentage decrease \\
from previous year
\end{tabular} & \begin{tabular}{l}
200 \\
2700
\end{tabular} \( 100=7.4 \% \) & 500 & \\
\hline
\end{tabular}
f. How many times greater was the percentage decrease of rainforest from 1950-2000 than fron 1900-1950?
g. Describe how you would find the area of the rainforest in 2050 if the decrease of rainforest continues in the manner found in the previous section.
Also, find the predicted area of rainforest left in 2050 and explain your calculations. Add this information to the table above and to the graph.
Comment on the degree of accuracy of your answer?