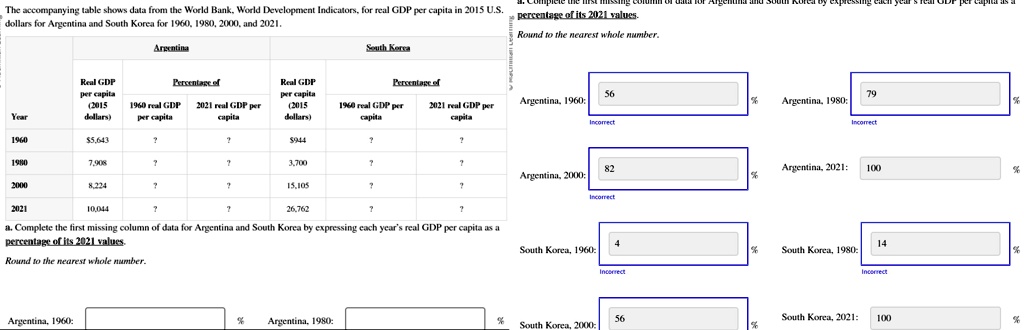
The accompanying table shows data from the World Bank, World Development Indicators, for real GDP per capita in 2015 U.S.
dollars for Argentina and South Korea for 1960, 1980, 2000, and 2021.
percentage of its 2021 values.
Round to the nearest whole number.
Argentina
South Korea
Real GDP
per capita
(2015
Percentage of
1960 real GDP
2021 real GDP per
Real GDP
per capita
(2015
Percentage of
56
Year
dollars)
per capita
capita
dollars)
capita
1960 real GDP per 2021 real GDP per
capita
Argentina, 1960:
79
Argentina, 1980:
Incorrect
1960
$5.643
?
?
$944
?
1980
7,908
?
?
3,700
?
?
82
Argentina, 2021: 100
%
Argentina, 2000:
2000
8,224
?
?
15,105
?
?
2021
10,044
26,762
a. Complete the first missing column of data for Argentina and South Korea by expressing each year's real GDP per capita as a
percentage of its 2021 values.
South Korea, 1960:
14
South Korea, 1980:
Round to the nearest whole number.
Argentina, 1960:
%
Argentina, 1980:
%
56
South Korea, 2021:
100
%
South Korea, 2000: