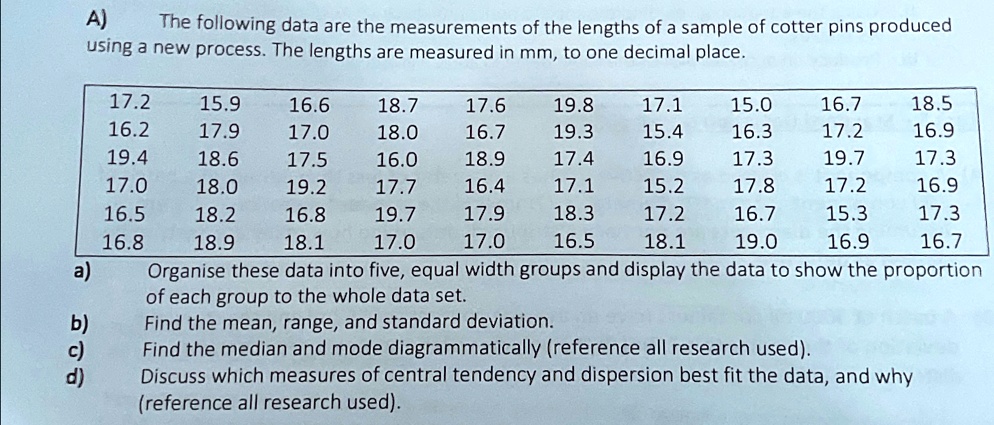
A) The following data are the measurements of the lengths of a sample of cotter pins produced using a new process. The lengths are measured in mm, to one decimal place.
able[[17.2,15.9,16.6,18.7,17.6,19.8,17.1,15.0,16.7,18.5],[16.2,17.9,17.0,18.0,16.7,19.3,15.4,16.3,17.2,16.9],[19.4,18.6,17.5,16.0,18.9,17.4,16.9,17.3,19.7,17.3],[17.0,18.0,19.2,17.7,16.4,17.1,15.2,17.8,17.2,16.9],[16.5,18.2,16.8,19.7,17.9,18.3,17.2,16.7,15.3,17.3],[16.8,18.9,18.1,17.0,17.0,16.5,18.1,19.0,16.9,16.7]]
a) Organise these data into five, equal width groups and display the data to show the proportion of each group to the whole data set.
b) Find the mean, range, and standard deviation.
c) Find the median and mode diagrammatically (reference all research used).
d) Discuss which measures of central tendency and dispersion best fit the data, and why (reference all research used).
A)
17.2 15.9 16.6 18.7 17.6 19.8 17.1 15.0 16.7 18.5 16.2 17.9 17.0 18.0 16.7 19.3 15.4 16.3 17.2 16.9 19.4 18.6 17.5 16.0 18.9 17.4 16.9 17.3 19.7 17.3 17.0 18.0 19.2 17.7 16.4 17.1 15.2 17.8 17.2 16.9 16.5 18.2 16.8 19.7 17.9 18.3 17.2 16.7 15.3 17.3 16.8 18.9 18.1 17.0 17.0 16.5 18.1 19.0 16.9 16.7 a) Organise these data into five,equal width groups and display the data to show the proportion of each group to the whole data set. b) Find the mean,range, and standard deviation. c) Find the median and mode diagrammatically (reference all research used). d) Discuss which measures of central tendency and dispersion best fit the data, and why (reference all research used)