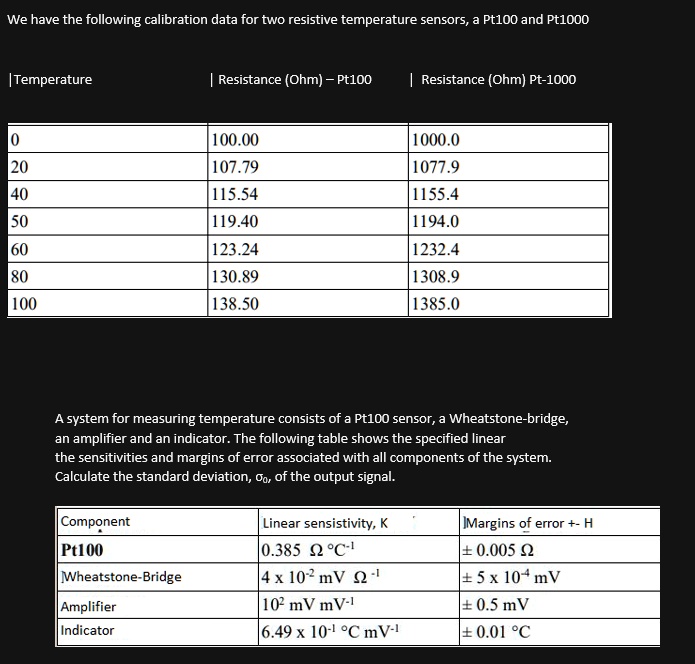
We have the following calibration data for two resistive temperature sensors, a Pt100 and Pt1000
Temperature
| Resistance (Ohm) - Pt100
| Resistance (Ohm) Pt-1000
0
100.00
1000.0
20
107.79
1077.9
40
115.54
1155.4
50
119.40
1194.0
60
123.24
1232.4
80
130.89
1308.9
100
138.50
1385.0
A system for measuring temperature consists of a Pt100 sensor, a Wheatstone-bridge,
an amplifier and an indicator. The following table shows the specified linear
the sensitivities and margins of error associated with all components of the system.
Calculate the standard deviation, $\sigma_o$, of the output signal.
Component
Pt100
Margins of error +- H
Linear sensistivity, K
$0.385 \Omega \, \degree C^{-1}$
$\pm 0.005 \Omega$
Wheatstone-Bridge
$4 \times 10^2 mV \Omega^{-1}$
$\pm 5 \times 10^{-4} mV$
Amplifier
$10^2 mV \, mV^{-1}$
$\pm 0.5 mV$
Indicator
$6.49 \times 10^{-1} \degree C \, mV^{-1}$
$\pm 0.01 \degree C$