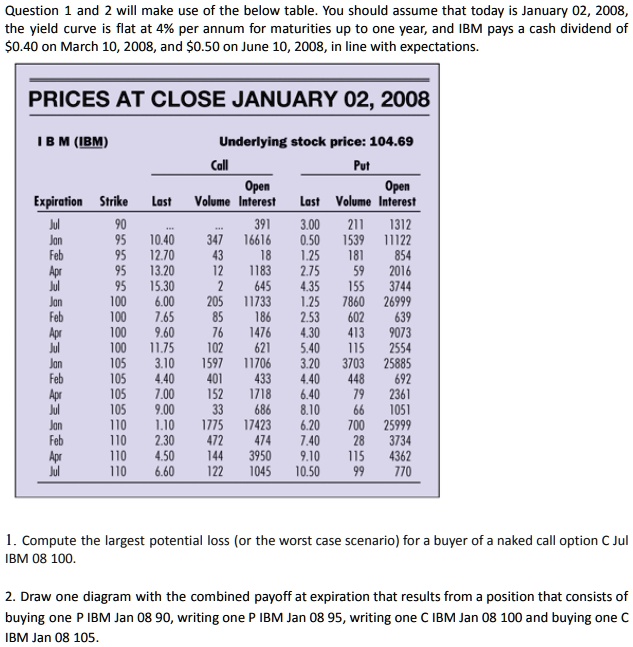
Text: Question 1 and 2 will make use of the below table. You should assume that today is January 02, 2008, the yield curve is flat at 4% per annum for maturities up to one year, and IBM pays a cash dividend of $0.40 on March 10, 2008, and $0.50 on June 10, 2008, in line with expectations.
PRICES AT CLOSE JANUARY 02, 2008
IBM (IBM)
Underlying stock price: 104.69
Call Put Open Open Expiration Strike Last Volume Interest Last Volume Interest Jul 90 391 3.00 211 1312 Jan 95 10.40 347 16616 0.50 1539 11122 Feb 95 12.70 43 18 1.25 181 854 Apr 95 13.20 12 1183 2.75 59 2016 Jul 95 15.30 2 645 4.35 155 3744 Jan 100 6.00 205 11733 1.25 7860 26999 Feb 100 7.65 85 186 2.53 602 639 Apr 100 9.60 76 1476 4.30 413 9073 Jul 100 11.75 102 621 5.40 115 2554 Jan 105 3.10 1597 11706 3.20 3703 25885 Feb 105 4.40 401 433 4.40 448 692 Apr 105 7.00 152 1718 6.40 79 2361 Jul 105 6.33 33 686 8.10 66 1051 Jan 110 1.10 1775 17423 6.20 700 25999 Feb 110 2.30 472 474 7.40 28 3734 Apr 110 4.50 144 3950 9.10 115 4362 Jul 110 6.60 122 1045 10.50 66 770
1. Compute the largest potential loss (or the worst-case scenario) for a buyer of a naked call option C Jul IBM 08 100
2. Draw one diagram with the combined payoff at expiration that results from a position that consists of buying one P IBM Jan 08 90, writing one P IBM Jan 08 95, writing one C IBM Jan 08 100, and buying one C IBM Jan 08 105