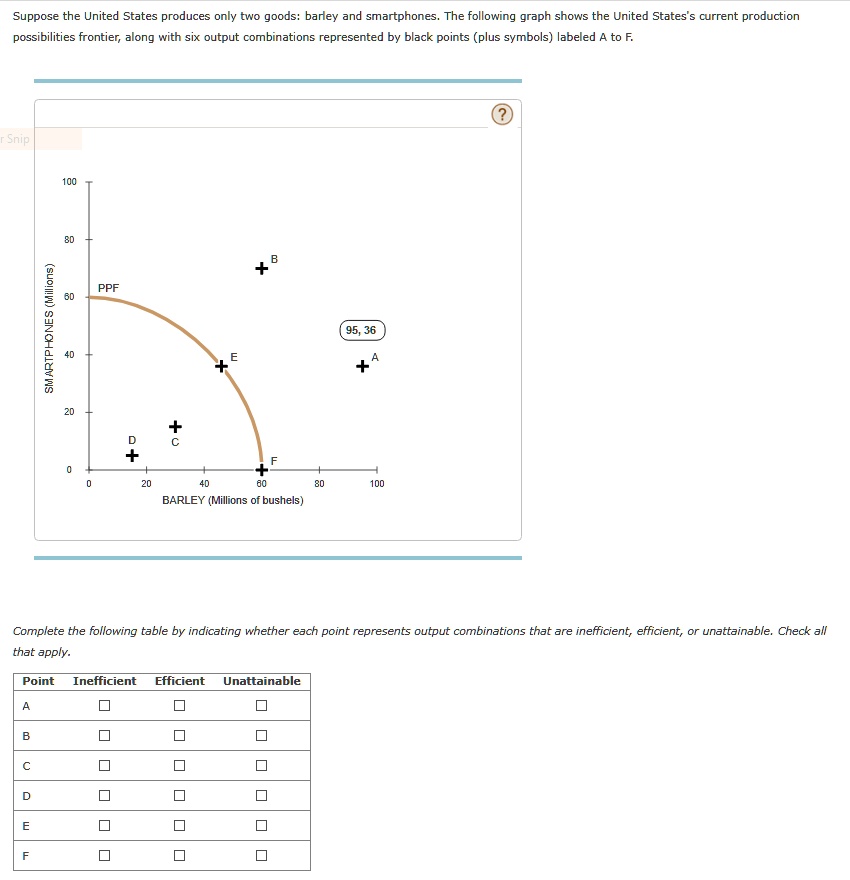
Suppose the United States produces only two goods: barley and smartphones. The following graph shows the United States's current production possibilities frontier, along with six output combinations represented by black points (plus symbols) labeled A to F.
SMARTPHONES (Millions)
100
80
60
40
20
PPF
B
D
0
0
20
40
E
60
80
100
BARLEY (Millions of bushels)
95, 36
A
F
Complete the following table by indicating whether each point represents output combinations that are inefficient, efficient, or unattainable. Check all that apply.
Point Inefficient Efficient Unattainable
A
B
C
D
E
F