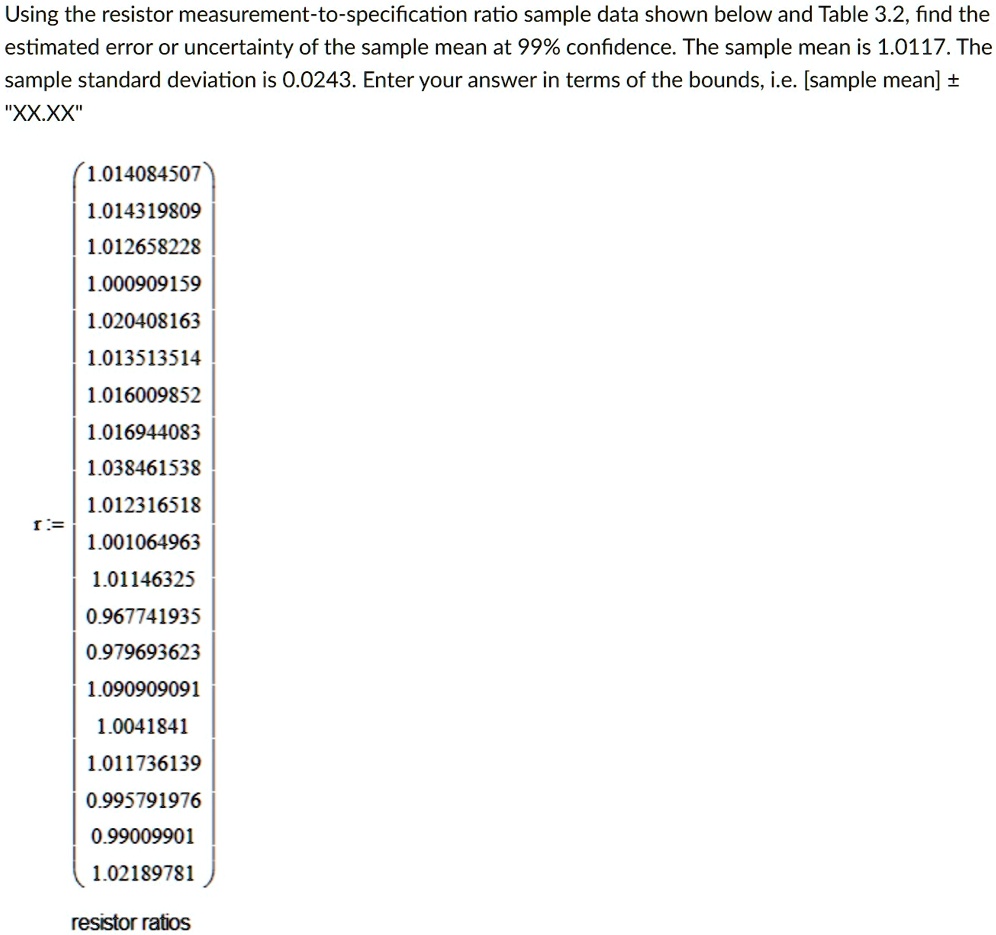
Using the resistor measurement-to-specification ratio sample data shown below and Table 3.2, find the estimated error or uncertainty of the sample mean at 99% confidence. The sample mean is 1.0117. The sample standard deviation is 0.0243. Enter your answer in terms of the bounds, i.e. [sample mean] +- "XX.XX"
r:=([1.014084507],[1.014319809],[1.012658228],[1.000909159],[1.020408163],[1.013513514],[1.016009852],[1.016944083],[1.038461538],[1.012316518],[1.001064963],[1.01146325],[0.967741935],[0.979693623],[1.090909091],[1.0041841],[1.011736139],[0.995791976],[0.99009901],[1.02189781])
resistor ratios
Using the resistor measurement-to-specification ratio sample data shown below and Table 3.2, find the estimated error or uncertainty of the sample mean at 99% confidence. The sample mean is 1.0117. The sample standard deviation is 0.0243. Enter your answer in terms of the bounds, i.e. [sample mean] +- "XX.XX".
1.014084507
1.014319809
1.012658228
1.000909159
1.020408163
1.013513514
1.016009852
1.016944083
1.038461538
1.012316518
1.001064963
1.01146325
0.967741935
0.979693623
1.090909091
1.0041841
1.011736139
0.995791976
0.99009901
1.02189781
resistor ratios