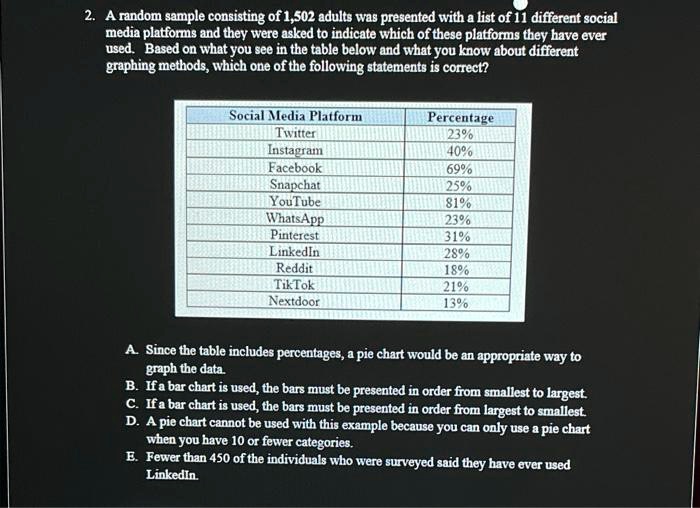
2. A random sample consisting of 1,502 adults was presented with a list of 11 different social
media platforms and they were asked to indicate which of these platforms they have ever
used. Based on what you see in the table below and what you know about different
graphing methods, which one of the following statements is correct?
Social Media Platform
Percentage
Twitter
23%
Instagram
40%
Facebook
69%
Snapchat
25%
YouTube
81%
WhatsApp
23%
Pinterest
31%
LinkedIn
28%
Reddit
18%
Tik Tok
21%
Nextdoor
13%
A. Since the table includes percentages, a pie chart would be an appropriate way to
graph the data.
B. If a bar chart is used, the bars must be presented in order from smallest to largest.
C. If a bar chart is used, the bars must be presented in order from largest to smallest.
D. A pie chart cannot be used with this example because you can only use a pie chart
when you have 10 or fewer categories.
E. Fewer than 450 of the individuals who were surveyed said they have ever used
LinkedIn.