14
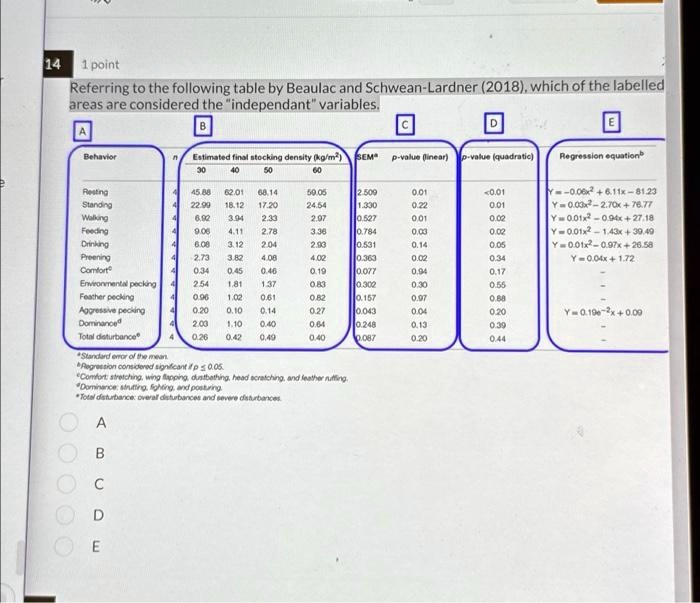
1 point Referring to the following table by Beaulac and Schwean-Lardner (2018), which of the labelled areas are considered the "independent" variables. B A Behavior Resting Standing Walking Feeding Drinking Preening Comfort Environmental pecking Feather pecking Aggressive pecking Dominance Total disturbance A B C D E Estimated final stocking density (kg/m²) SEM 30 40 50 60 45.88 62.01 68.14 59.05 22.99 18.12 17.20 24.54 6.92 3.94 2.33 2.97 9.08 4.11 2.78 3.36 6.08 3.12 2.04 2.93 2.73 3.82 4.08 4.02 0.34 0.45 0.46 0.19 2.54 1.81 1.37 0.83 0.96 1.02 0.61 0.82 0.20 0.10 0.14 0.27 2.03 1.10 0.40 0.64 0.26 0.42 0.49 0.40 Standard error of the mean. Regression considered significant if p ≤ 0.05. Comfort: stretching, wing flapping, dustbathing, head scratching, and feather ruffling. Dominance: strutting, fighting, and posturing. Total disturbance: overall disturbances and severe disturbances. p-value (linear) p-value (quadratic) 0.01 0.22 0.01 0.03 0.14 0.02 0.94 0.30 0.97 0.04 0.13 0.20 <0.01 0.01 0.02 0.02 0.05 0.34 0.17 0.55 0.88 0.20 0.39 0.44 Regression equation Y=-0.06x2 +6.11x-81.23 Y = 0.03x²-2.70x + 76.77 Y=0.01x20.94x + 27.18 Y=0.01x21.43x +39.49 Y=0.01x2-0.97x + 26.58 Y=0.04x + 1.72 Y = 0.19e-2x +0.09