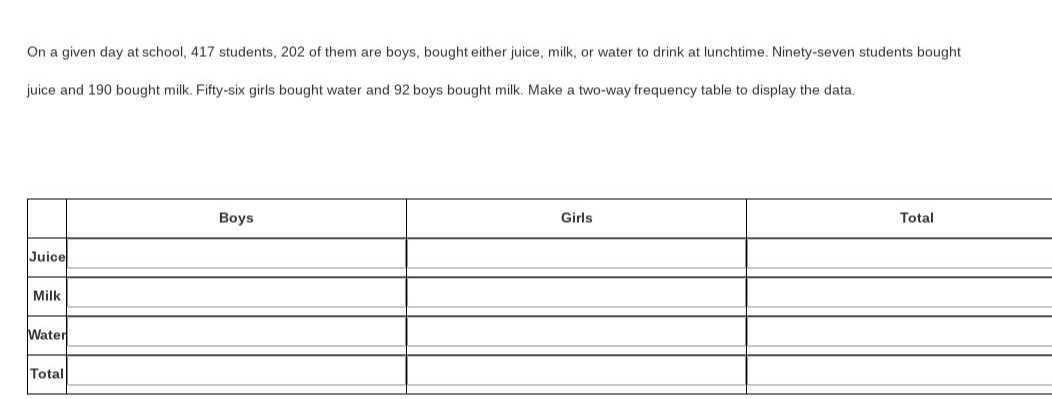
On a given day at school, 417 students, 202 of them are boys, bought either juice, milk, or water to drink at lunchtime. Ninety-seven students bought juice and 190 bought milk. Fifty-six girls bought water and 92 boys bought milk. Make a two-way frequency table to display the data.
\begin{tabular}{|l|l|l|l|}
\hline & Boys & Girls & Total \\
\hline Juice & & & \\
\hline Milk & & & \\
\hline Water & & & \\
\hline Total & & & \\
\hline
\end{tabular}