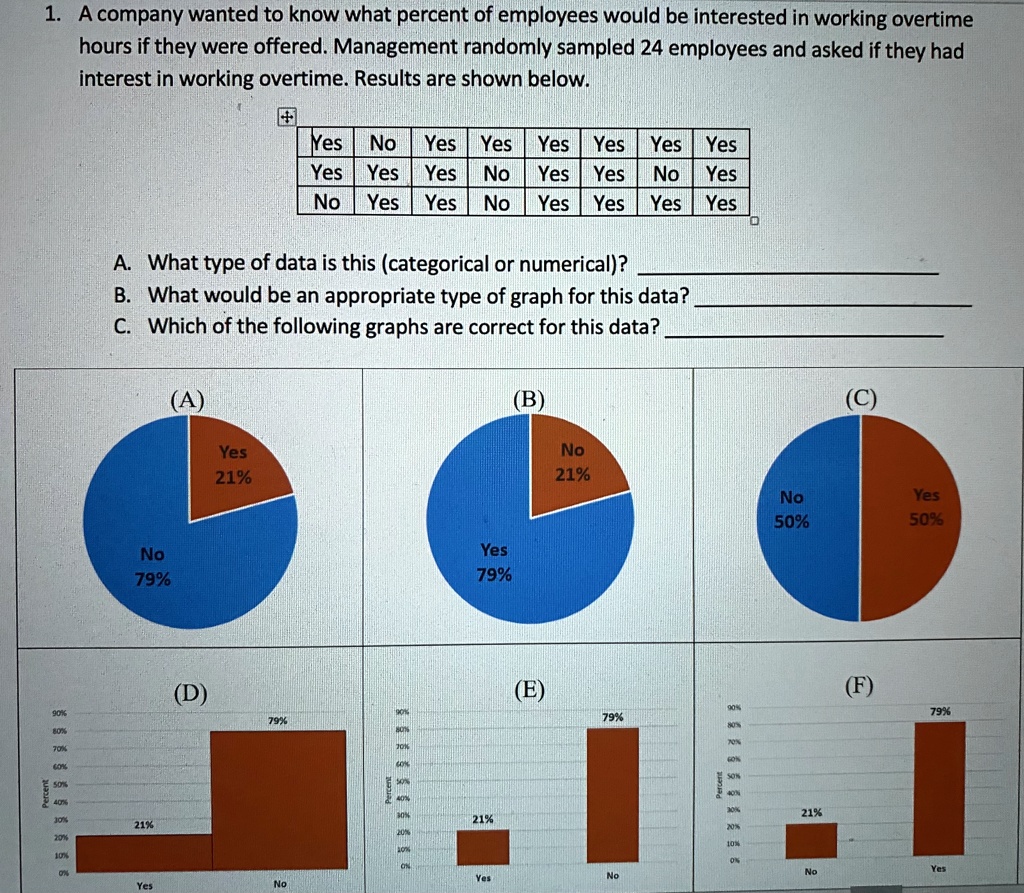
A company wanted to know what percent of employees would be interested in working overtime hours if they were offered. Management randomly sampled 24 employees and asked if they had interest in working overtime. Results are shown below.
able[[Yes,No,Yes,Yes,Yes,Yes,Yes,Yes],[Yes,Yes,Yes,No,Yes,Yes,No,Yes],[No,Yes,Yes,No,Yes,Yes,Yes,Yes]]
A. What type of data is this (categorical or numerical)?
B. What would be an appropriate type of graph for this date
C. Which of the following graphs are correct for this data?
1. A company wanted to know what percent of employees would be interested in working overtime hours if they were offered.Management randomly sampled 24 employees and asked if they had interest in working overtime.Results are shown below
Yes No Yes IYes Yes Yes Yes Yes Yes Yes Yes No Yes Yes No Yes No Yes Yes No Yes Yes Yes Yes
A.What type of data is this(categorical or numerical)? B.What would be an appropriate type of graph for this data? C.Which of the following graphs are correct for this data?
(A)
(B
(C)
Yes 21%
No 21%
No 50%
Yes 50%
No 79%
Yes 79%
(D)
(E)
(F)
90% 80% 70%6 60% I 30% 20% 10%
79%
79%
79%
21% 6556 Yes
30% 2o% 10N 0%
21%
21%
No
Ye
Yes
No