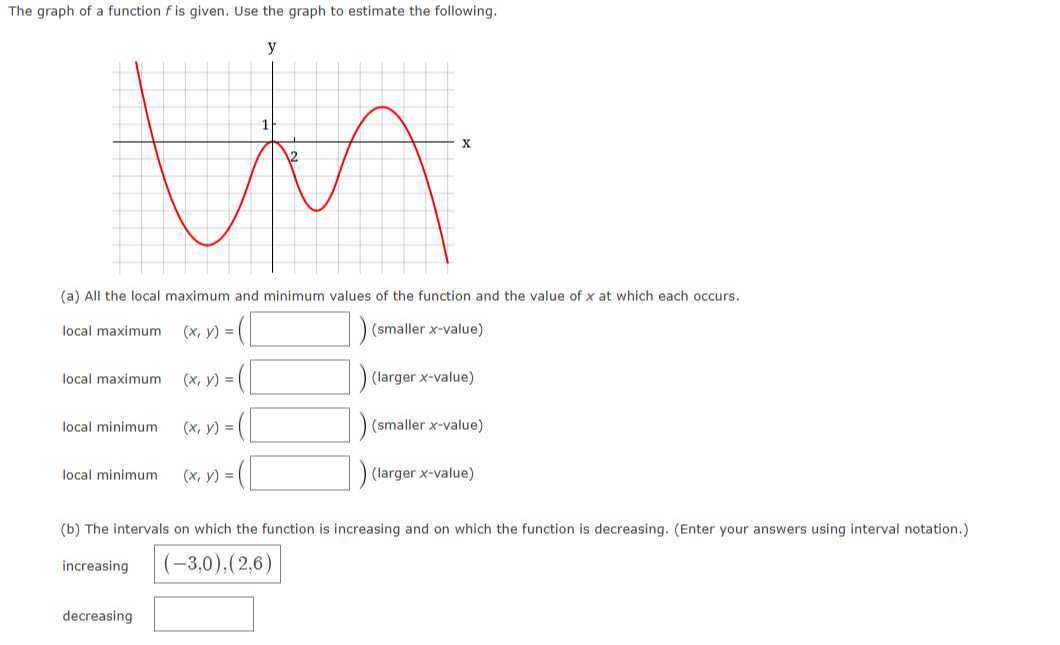
The graph of a function \( f \) is given. Use the graph to estimate the following.
(a) All the local maximum and minimum values of the function and the value of \( x \) at which each occurs.
local maximum \( (x, y)=( \) \( \square \) ) (smaller \( x \)-value)
local maximum \( (x, y)= \) ( \( \square \) ) (larger \( x \)-value)
local minimum \( \quad(x, y)=(\square \) \( \square \) ) (smaller \( x \)-value)
local minimum \( \quad(x, y)=( \) \( \square \) ) (larger \( x \)-value)
(b) The intervals on which the function is increasing and on which the function is decreasing. (Enter your answers using interval notation.) increasing \( (-3,0),(2,6) \)
decreasing \( \square \)