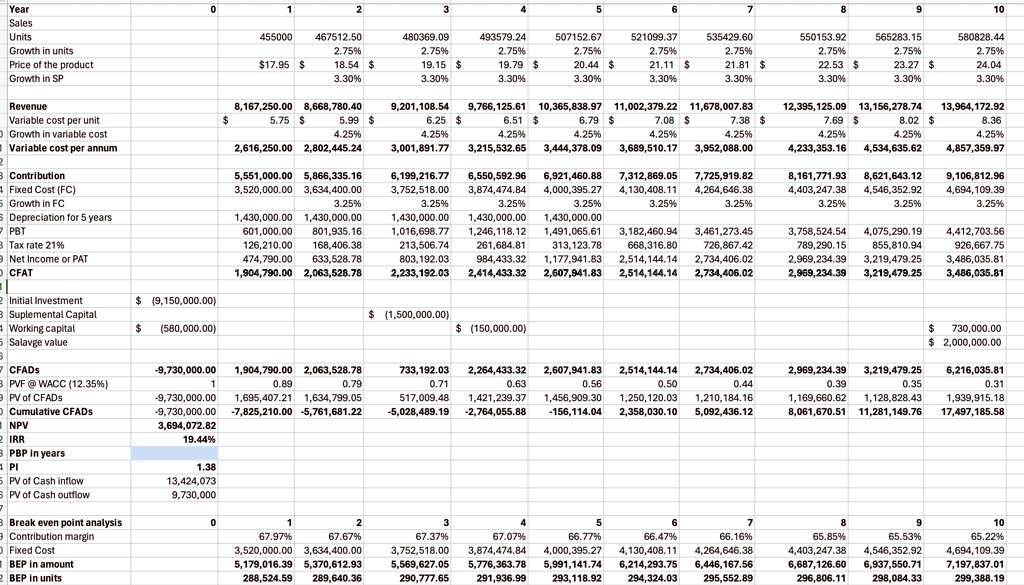
What is Payback Period (PBP in years)? Please help me calculate it
Year Sales Units Growth in units Price of the product Growth in SP
0
1
2
3
4
5
6
7
8
9
10
455000
467512.50 2.75% $17.95$ 18.54$ 3.30%
480369.09 2.75% 19.15$ 3.30%
493579.24 507152.67 521099.37 535429.60 2.75% 2.75% 2.75% 2.75% 19.79$ 20.44$ 21.11$ 21.81$ 3.30% 3.30% 3.30% 3.30%
550153.92 565283.15 2.75% 2.75% 22.53$ 23.27$ 3.30% 3.30%
580828.44 2.75% 24.04 3.30%
Revenue Variable cost per unit Growth in variable cost Variable cost per annum
8,167,250.00 8,668,780.40 $ 5.75 $ 5.99$ 4.25% 2,616,250.00 2,802,445.24
9,201,108.54 9,766,125.61 10,365,838.97 11,002,379.22 11,678,007,83 6.25$ 6.51$ 6.79$ 7.08$ 7.38 4.25% 4.25% 4.25% 4.25% 4.25% 3,001,891.77 3,215,532,65 3,444,378,09 3,689,510.17 3,952,088,00
12,395,125.09 13,156,278.74 13,964,172.92 7.69$ 8.02$ 8.36 4.25% 4.25% 4.25% 4,233,353,16 4,534,635.62 4,857,359,97
3Contribution Fixed Cost (FC) Growth in FC Depreciation for 5 years 7PBT Tax rate 21% Net Income or PAT CFAT
5,551,000.00 5,866,335.16 3,520,000.00 3,634,400.00 3.25% 1,430,000.00 1,430,000.00 601,000.00 801,935.16 126,210.00 168,406.38 474,790.00 633,528.78 1,904,790,00 2,063,528.78
6,199,216.77 3,752,518.00 3.25% 1,430,000.00 1,016,698.77 213,506.74 803,192.03 2,233,192,03
6,550,592,96 6,921,460,88 7,312,869.05 7,725,919,82 3,874,474.84 4,000,395.27 4,130,408.11 4,264,646.38 3.25% 3.25% 3.25% 3.25% 1,430,000.00 1,430,000.00 1,246,118.12 1,491,065.61 3,182,460.94 3,461,273,45 261,684.81 313,123.78 668,316.80 726,867,42 984,433.32 1,177,941.83 2,514,144,14 2,734,406.02 2,414,433,32 2,607,941,83 2,514,144,14 2,734,406,02
8,161,771.93 4,403,247.38 3.25%
8,621,643.12 4,546,352.92 3.25%
9,106,812.96 4,694,109.39 3.25%
3,758,524,54 789,290.15 2,969,234,39 2,969,234,39
4,075,290.19 855,810.94 3,219,479.25 3,219,479,25
4,412,703.56 926,667.75 3,486,035.81 3,486,035,81
Initial Investment 3Suplemental Capital Working capital Salavge value
$9,150,000.00
$ (1,500,000.00) $150.000.00
S
(580,000.00)
$ 730,000.00 $2,000,000.00
CFADs 3PVF @WACC (12.35% PV of CFADs Cumulative CFADs NPV IRR PBP in years PI PV of Cash inflow PV of Cash outflow
-9,730,000,00 1,904,790.00 2,063,528.78 7 0.89 0.79 -9,730,000.00 1,695,407.21 1,634,799.05 -9,730,000.00 -7,825,210.00 -5,761,681.22 3,694,072,82 19.44%
733,192.03 0.71 517,009,48 -5,028,489.19
2,264,433,32 0.63 1,421,239,37 -2,764,055.88
2,607,941,83 0.56 1,456,909.30 -156,114.04
2,514,144,14 2,734,406,02 0.50 0.44 1,250,120.03 1,210,184.16 2,358,030.10 5,092,436.12
2,969,234,39 3,219,479,25 0.39 0.35 1,169,660.62 1,128,828,43 8,061,670.51 11,281,149.76
6,216,035.81 0.31 1,939,915.18 17,497,185.58
1.38 13,424,073 9,730,000
Break even point analysis Contribution margin Fixed Cost BEP in amount BEP in units
0
1 2 67.97% 67.67% 3,520,000.00 3,634,400.00 5,179,016.39 5,370,612,93 288,524,59 289,640.36
3 67.37% 3,752,518.00 5,569,627,05 290,777,65
4 67.07% 3,874,474,84 5,776,363.78 291,936.99
5 6 7 66.77% 66.47% 66.16% 4,000,395.27 4,130,408.11 4,264,646.38 5,991,141.74 6,214,293.75 6,446,167,56 293,118.92 294,324.03 295,552,89
8 65.85% 4,403,247,38 6,687,126.60 296,806.11
10 65.22% 4,694,109.39 7,197,837.01 299,388.19
65.53% 4,546,352.92 6,937,550.71 298,084.33