This case is designed to illustrate the importance of financial forecasting when planning a corporation's future operations.
In particular, it allows you the opportunity to go through the mechanics of financial forecasting using both the AFN formula and the percentage of sales method.
All dollar amounts are in millions. The model uses an explicit iterative procedure to take account of financial feedbacks in financing the AFN.
Sensitivity analysis is conducted by changing input variables and observing changes in the output variables: data tables can be used to facilitate this operation.
INPUT DATA:
Sales growth rate
1996 Div per share
1995 shares (in M)
Stock price
D/A used for AFN
Tax rate
ST interest rate
IT interest rate
Capacity utiliz.
KEY OUTPUT:
(In Millions of Dollars)
- MMS CAPACITY Questions & Answers + Workbook Statistics
Table 3. Historical and Projected Financial statements (in Millions)
BALANCE SHEETS:
Net fixed assets Total assets
42
43
44 Accounts payable
45 Notes payable
46 Accr. wages & taxes
47
48
Curr. liabilities
able[[27.36,32.48%,32.83,32.83,32.83,32.83],[$42.12,N.A.,$51.89,$51.89,$51.89,$51.89
A
D
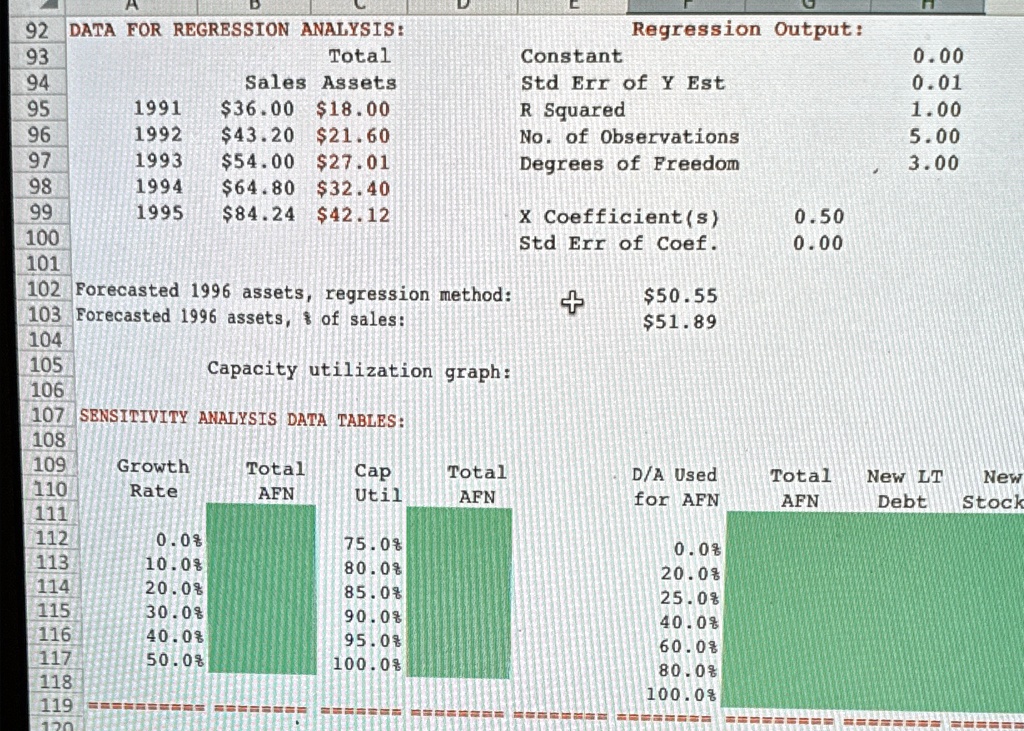
92 DATA FOR REGRESSION ANALYSIS: Regression Output: 93 Total Constant 0.00 94 Sales Assets StdErr of Y Est 0.01 95 1991 $36.00 $18.00 R Squared 1.00 96 1992 $43.20 $21.60 No of Observations 5.00 97 1993 $54.00 $27.01 Degrees of Freedom 3.00 98 1994 $64.80 $32.40 99 1995 $84.24 $42.12 X Coefficients) 0.50 100 Std Error of Coef 0.00 101 102 Forecasted 1996 assets, regression method: + $50.55 103 Forecasted 1996 assets of sales: $51.89 104 105 Capacity utilization graph: 106 107 SENSITIVITY ANALYSIS DATA TABLES: 108 109 Growth Total Cap Total D/A Used Total New LT New 110 Rate AFN Util AFN for AFN AFN Debt Stock 111 112 0.0 75.0 0.0 113 10.0 80.0 20.0 114 20.0 85.0 25.0 115 300 900 40.0 116 40.0% 95.0 60.0 117 50.0% 100.0 008 118 100.0% 119 10