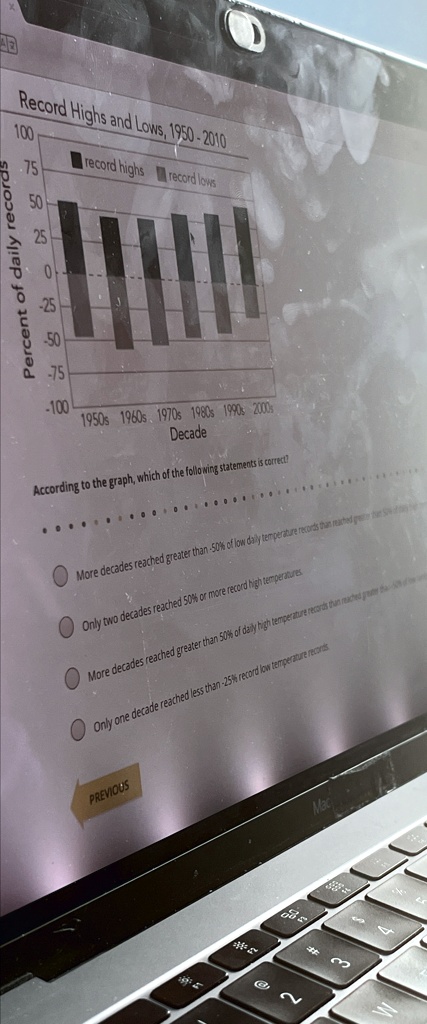
Record Highs and Lows, 1950 - 2010
100
75
50
25
0
-25
-50
-75
-100
Percent of daily records
record highs record lows
1950s 1960s 1970s 1980s 1990s 2000s
Decade
According to the graph, which of the following statements is correct?
More decades reached greater than -50% of low daily temperature records than reached greater than 50% of daily high temperature records.
Only two decades reached 50% or more record high temperatures.
More decades reached greater than 50% of daily high temperature records than reached greater than -50% of low daily temperature records.
Only one decade reached less than -25% record low temperature records.
PREVIOUS