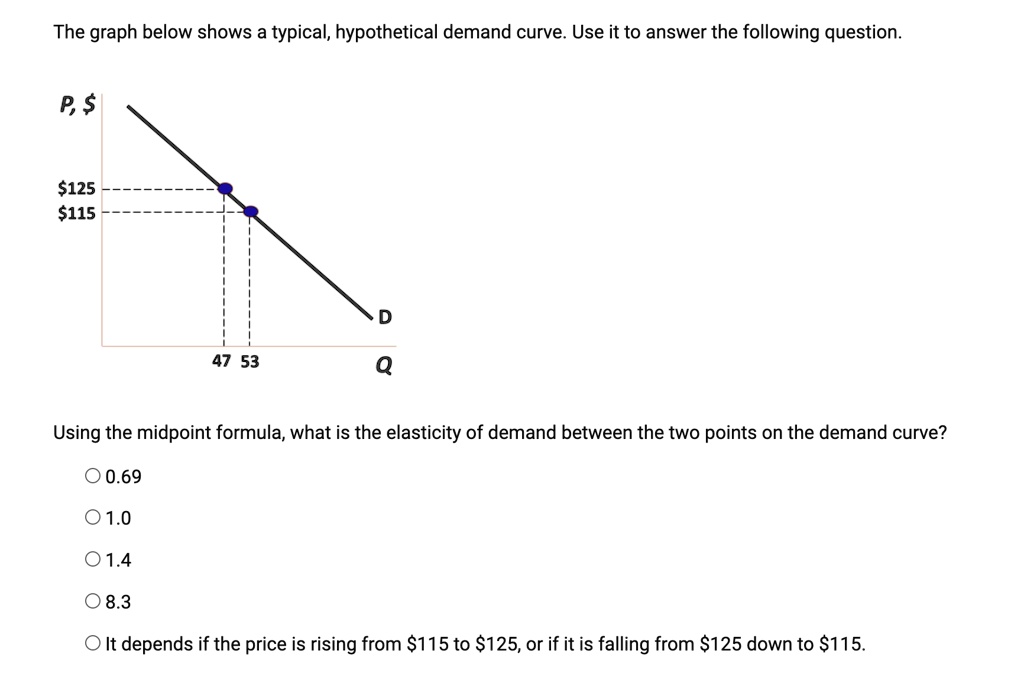
The graph below shows a typical, hypothetical demand curve. Use it to answer the following question.
P, $
$125
$115
D
47 53
Q
Using the midpoint formula, what is the elasticity of demand between the two points on the demand curve?
? 0.69
? 1.0
? 1.4
? 8.3
? It depends if the price is rising from $115 to $125, or if it is falling from $125 down to $115.