Learning
Macmillan Le
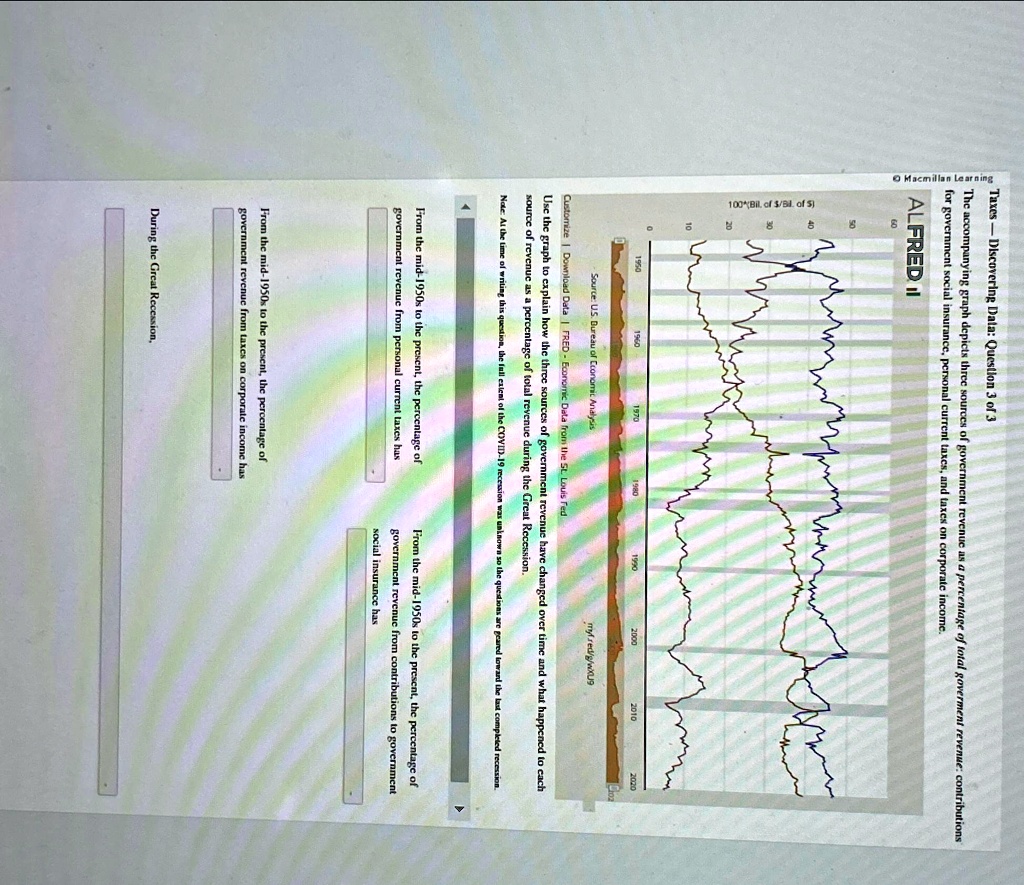
Taxes - Discovering Data: Question 3 of 3
The accompanying graph depicts three sources of government revenue as a percentage of total goverment revenue: contributions
for government social insurance, personal current taxes, and taxes on corporate income.
ALFREDI
60
100"Bil. of $/Bil. of $
9
1950
1960
1970
1980
1990
2000
2010
2020
Source: U.S. Bureau of Economic Analysis
Customize | Download Data | FRED - Economic Data from the St. Louis Fed
myf.red/g/wXU9
Use the graph to explain how the three sources of government revenue have changed over time and what happened to each
source of revenue as a percentage of total revenue during the Great Recession.
Note: At the time of writing this question, the full extent of the COVII)-19 recession was unknown so the questions are geared toward the last completed recession.
4
From the mid-1950s to the present, the percentage of
government revenue from personal current taxes has
From the mid-1950s to the present, the percentage of
government revenue from taxes on corporate income has
During the Great Recession,
From the mid-1950s to the present, the percentage of
government revenue from contributions to government
social insurance has