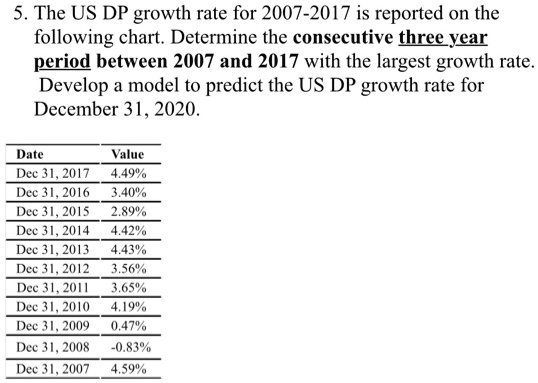
5. The US DP growth rate for 2007-2017 is reported on the
following chart. Determine the consecutive three year
period between 2007 and 2017 with the largest growth rate.
Develop a model to predict the US DP growth rate for
December 31, 2020.
Date
Value
Dec 31, 2017 4.49%
Dec 31, 2016
3.40%
Dec 31, 2015
2.89%
Dec 31, 2014
4.42%
Dec 31, 2013
4.43%
Dec 31, 2012
3.56%
Dec 31, 2011
3.65%
Dec 31, 2010
4.19%
Dec 31, 2009
0.47%
Dec 31, 2008
-0.83%
Dec 31, 2007
4.59%